
The following pie chart shows the percentage share of value-wise sales of five brands A, B, C, D, and E in 2005. In 2006, if sales value of B increases by 10% and that of A decreases by 10%, what is…
Question and options
The following pie chart shows the percentage share of value-wise sales of five brands A, B, C, D, and E in 2005.
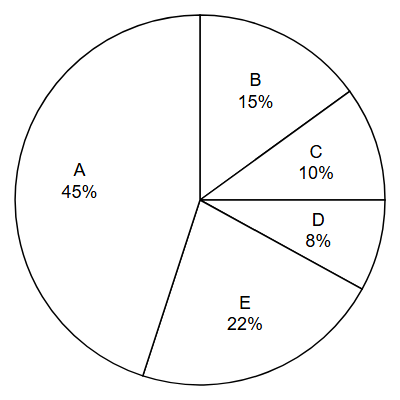
In 2006, if sales value of B increases by 10% and that of A decreases by 10%, what is the percentage change in sales, if sale of all other brands remain same?
- No change
- Decrease by 3%
- Increase by 6%
- Decrease by 1%
Answer and explanation
Correct answer: B - Decrease by 3%
With total 100: B +10% of 15 = +1.5, A -10% of 45 = -4.5. Net change = -3, i.e. total decreases by 3%.
Practice for these exams
-
JIPMAT
Related question papers
Related exam syllabi
More solved explanations in Data interpretation
- The following is the data pertaining to four movies which have collected gross revenues in domestic and international markets in Million USD ($). Arrange them in…
- The following table shows the number of employees and their median age in eight companies located in a district. CompanyNumber of employeesMedian age A 32 24 B 28…
- Directions: Read the information given and answer the question. (i) There is a group of seven persons A, B, C, D, E, F and G. (ii) There are four males, three…
- Analyze the given data for exports and imports of rubber in Rs. crores from 2006 to 2017 and answer the question based on the analysis. The percentage increase in…
- Directions: The table gives the percentage of marks obtained by seven students in six different subjects in an examination. Study the table and answer the question…