
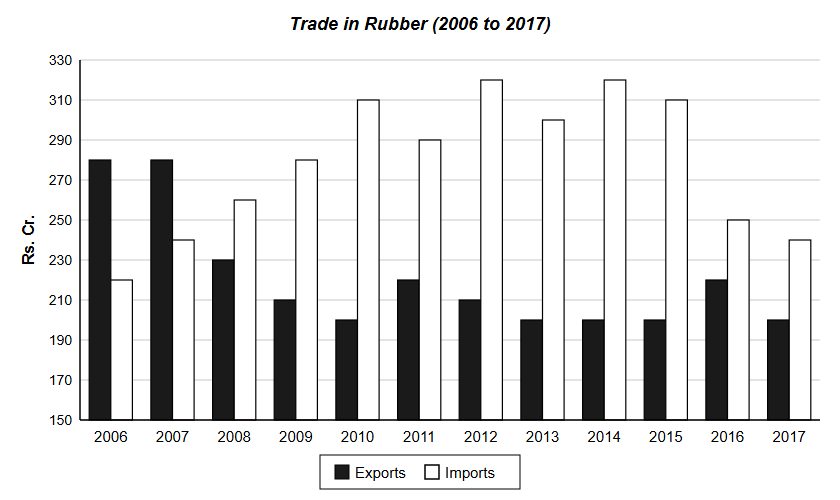
Analyze the given data for exports and imports of rubber in Rs. crores from 2006 to 2017 and answer the question based on the analysis. The percentage increase in imports over the preceding year is…
Question and options
Analyze the given data for exports and imports of rubber in Rs. crores from 2006 to 2017 and answer the question based on the analysis.
The percentage increase in imports over the preceding year is maximum during
The percentage increase in imports over the preceding year is maximum during
- 2009 to 2010
- 2010 to 2011
- 2013 to 2014
- 2008 to 2009
Answer and explanation
Correct answer: A - 2009 to 2010
Imports: 2008 260, 2009 280, 2010 310, 2011 290, 2013 300, 2014 320. Growth: 2009->10 10.7%, 2010->11 negative, 2013->14 6.7%, 2008->09 7.7%. Max is 2009 to 2010.
Practice for these exams
-
IPMAT Indore
Related question papers
Related exam syllabi
More solved explanations in Data interpretation
- Study the following bar graph, then answer the question given below it : Which state has twice the percentage of villages electrified in comparison to state 'D' ?
- The following Pie-chart shows the marks obtained by a student in an examination, who scored 540 marks in all. Find the subject in which student got 108 marks.
- ColorLight : Dark Red 3 : 4 Blue 5 : 3 Green 1 : 3 Pink 1 : 7 Yellow 9 : 5 Orange 7 : 9 In a box, there are several balls. The pie-chart shows the percentage-wise…
- Directions: Read the information given and answer the question. (i) There is a group of seven persons A, B, C, D, E, F and G. (ii) There are four males, three…
- ColorLight : Dark Red 3 : 4 Blue 5 : 3 Green 1 : 3 Pink 1 : 7 Yellow 9 : 5 Orange 7 : 9 In a box, there are several balls. The pie-chart shows the percentage-wise…