
The following pie chart shows the percentage share of value-wise sales of five brands A, B, C, D, and E in 2005. In 2006, value wise sale of A increased by 50% and that of E increased by 10%. The…
Question and options
The following pie chart shows the percentage share of value-wise sales of five brands A, B, C, D, and E in 2005.
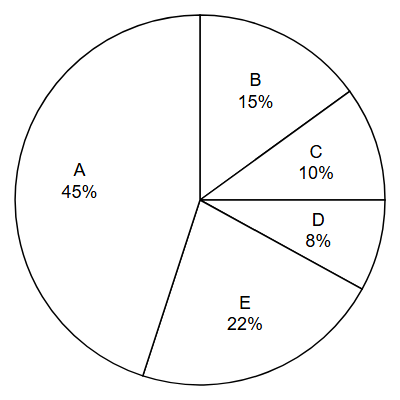
In 2006, value wise sale of A increased by 50% and that of E increased by 10%. The sales of all other brands remained the same. By what percentage total sales (value wise) grew in 2006 as compared to 2005?
- 124%
- 60%
- 24.70%
- 12.10%
Answer and explanation
Correct answer: C - 24.70%
Take 2005 total = 100: A rises 45 -> 67.5 (+22.5), E rises 22 -> 24.2 (+2.2). Total increase = 24.7, i.e. 24.70% growth.
Practice for these exams
-
JIPMAT
Related question papers
Related exam syllabi
More solved explanations in Data interpretation
- Population of three towns (in thousands) in four years given in bar graph and percentage of literate population of the towns given in line graph (some of the data…
- The following table presents the quoted buy and sell prices of five stocks during the five trading days of a given week. The quoted sell price is the price at…
- Directions: The table gives the percentage of marks obtained by seven students in six different subjects in an examination. Study the table and answer the question…
- The following bar diagram shows the birth rate per thousand of the population of four different countries A, B, C and D. If birth rate of country B is twice to…
- Directions: The bar graph gives the data of the production of cement (in lakh tonnes) by three different companies A, B and C over five years. Study the graph and…