
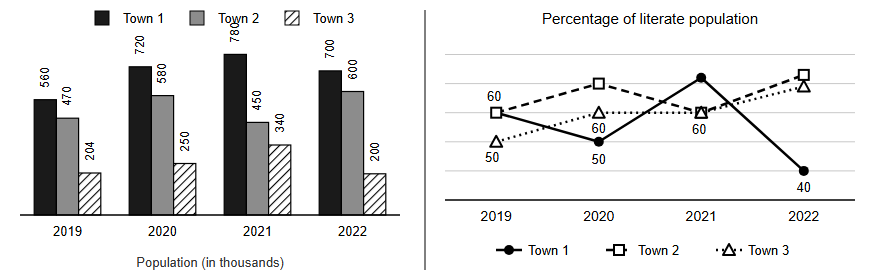
Population of three towns (in thousands) in four years given in bar graph and percentage of literate population of the towns given in line graph (some of the data is missing in the line graph).…
Question and options
Population of three towns (in thousands) in four years given in bar graph and percentage of literate population of the towns given in line graph (some of the data is missing in the line graph).
Following Table shows partial data of Percentage growth rate of literate population (year over
year)
What is the ratio between total population and literate population in 2019 in town 3?
Following Table shows partial data of Percentage growth rate of literate population (year over
year)
| Town 1 | Town 2 | Town 3 | |
|---|---|---|---|
| 2020 | (50/7)% | --- | --- |
| 2021 | (155/3)% | - (6800/203)% | 36% |
| 2022 | --- | (200/3)% | - (1600/51)% |
What is the ratio between total population and literate population in 2019 in town 3?
- 2:1
- 3:2
- 1:2
- 4:3
Answer and explanation
Correct answer: A - 2:1
Town 3 in 2019: population 204k, literacy 50%, so literate = 102k. Total : literate = 204 : 102 = 2 : 1. (Check: 2020 literate 60% of 250 = 150, x1.36 = 204 = 60% of 340 in 2021.)
Practice for these exams
-
IIM Bangalore BBA DBE Entrance Test
Related question papers
Related exam syllabi
More solved explanations in Data interpretation
- Read the passage and answer the question. An Indian company, having its registered office at Gurugram, is engaged in manufacturing of consumer goods at Noida. The…
- Read the passage and answer the question. A survey was conducted about the population of a particular region having working population of three lacs and…
- Based upon the following table which shows number of registered vehicles (in lakhs) in a city : Vehicle \ Year 1990-91 2000-01 2010-11 Car 4.77 9.27 25.38 Bus 1.02…
- Directions: Answer the question based on the information given. The rate of taxation in India has these slabs: Taxable Income (₹)Tax Rate 0–50,000 Exempt 50,000 –…
- The given figure shows the food liking of 1080 people of a city The percent of the people who like pasta is