
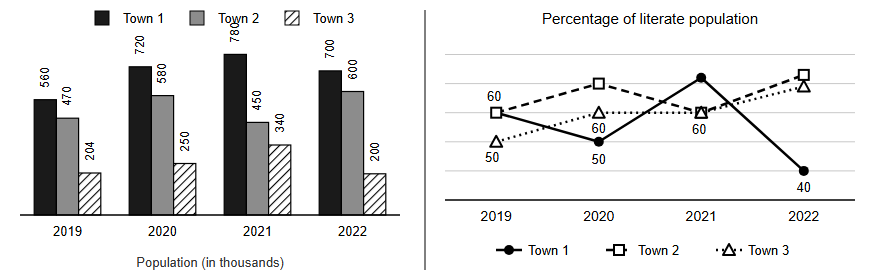
Population of three towns (in thousands) in four years given in bar graph and percentage of literate population of the towns given in line graph (some of the data is missing in the line graph).…
Question and options
Population of three towns (in thousands) in four years given in bar graph and percentage of literate population of the towns given in line graph (some of the data is missing in the line graph).
Following Table shows partial data of Percentage growth rate of literate population (year over
year)
Number of literate population of town 2 in year 2019 is approximately what percent of literate population of town 1 in the year 2021?
Following Table shows partial data of Percentage growth rate of literate population (year over
year)
| Town 1 | Town 2 | Town 3 | |
|---|---|---|---|
| 2020 | (50/7)% | --- | --- |
| 2021 | (155/3)% | - (6800/203)% | 36% |
| 2022 | --- | (200/3)% | - (1600/51)% |
Number of literate population of town 2 in year 2019 is approximately what percent of literate population of town 1 in the year 2021?
- 53.85%
- 52.75%
- 51.65%
- 50.62%
Answer and explanation
Correct answer: C - 51.65%
Town 2 2019 literate = 60% of 470k = 282k. Town 1 2021 literate = 360k x (1 + 155/300) = 546k. 282/546 = 51.65%.
Practice for these exams
-
IIM Bangalore BBA DBE Entrance Test
Related question papers
Related exam syllabi
More solved explanations in Data interpretation
- Directions: Study the bar graph given below and answer this question. It consists of data on the number of students who passed (in thousands) from two universities…
- Directions: Study the following table carefully and answer this question. It consists of the breakup of the expenses of a company over different years.…
- Study the graph and answer the question that follows: The graph indicates the cost of the production of a firm. A = Raw material cost B = Packing material cost C =…
- Study the given bar graph carefully and answer the question that follows : 501001502002503003500No. of TVs (in thousand)Production of TVs by 5 companies in…
- The diagram indicates the number of students taking different subjects. Which subject was taken by the largest number of students?