
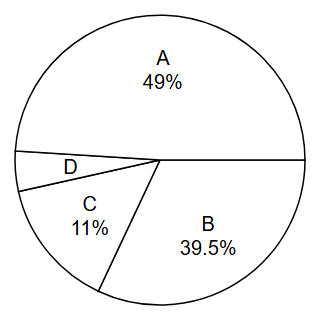
Study the graph and answer the question that follows: The graph indicates the cost of the production of a firm. A = Raw material cost B = Packing material cost C = Fixed manufacturing expenses D =…
Question and options
Study the graph and answer the question that follows:
A = Raw material cost
B = Packing material cost
C = Fixed manufacturing expenses
D = Labour cost
The total value in rupees of all sectors is 120.0 lakh.
If the total labour cost increases to Rs. 2.4 lakh, what percentage increase does it represent?
A = Raw material cost
B = Packing material cost
C = Fixed manufacturing expenses
D = Labour cost
The total value in rupees of all sectors is 120.0 lakh.
If the total labour cost increases to Rs. 2.4 lakh, what percentage increase does it represent?
- 25%
- 300%
- 400%
- 75%
Answer and explanation
Correct answer: B - 300%
D = 100 - 49 - 39.5 - 11 = 0.5%, so labour cost is 0.5% of 120 lakh = 0.6 lakh. Going from 0.6 to 2.4 lakh is an increase of 1.8/0.6 = 300%.
Practice for these exams
-
JIPMAT
Related question papers
Related exam syllabi
More solved explanations in Data interpretation
- Directions: The table gives the percentage of marks obtained by seven students in six different subjects in an examination. Study the table and answer the question…
- Directions: Study the bar graph given below and answer this question. What is the approximate percentage growth between 2007 and 2011?
- The table shows the production of sugar (in thousand tonnes) by six production units A–F from April to August of a year. MonthABCDEF April 310 180 169 137 140 120…
- Directions: The table shows the number of new employees added to different categories of employees in a company and also the number of employees from these…
- The pie chart shows the percentage of total number of students (male and female) in different institutes affiliated with an educational council, whereas the radar…