
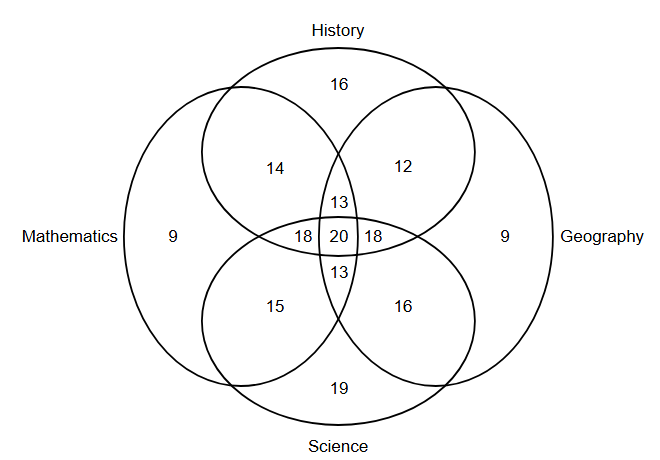
The diagram indicates the number of students taking different subjects. Which subject was taken by the largest number of students?
Question and options
The diagram indicates the number of students taking different subjects.
- Geography
- History
- Mathematics
- Science
Answer and explanation
Correct answer: D - Science
Adding all regions inside each oval: Science = 19+15+16+18+18+13+20 = 119, History = 111, Mathematics = 102, Geography = 101. Science is the largest.
Practice for these exams
-
JIPMAT
Related question papers
Related exam syllabi
More solved explanations in Data interpretation
- Abhishek’s total income for 2019 was ₹56,000. He allocated this income as follows: food 23%, housing 15%, child’s education 12%, transport 10%, clothing 10%,…
- Directions - The details of expenditure of monthly income of a family is given in the Pie chart. From this graphical data, answer question number 47 and 48 - If…
- The following table gives the expenditure details of a family during the years 2011 to 2015 . Item of ExpenditureExpenditure (in ₹ Thousands)…
- Read the passage and answer the question. World fruit production went up 54 percent between 2000 and 2019, to 883 million tonnes. Five fruit species accounted for…
- The following table gives the expenditure details of a family during the years 2011 to 2015 . Item of ExpenditureExpenditure (in ₹ Thousands)…