
ColorLight : Dark Red 3 : 4 Blue 5 : 3 Green 1 : 3 Pink 1 : 7 Yellow 9 : 5 Orange 7 : 9 In a box, there are several balls. The pie-chart shows the percentage-wise distribution of 6 different colours…
Question and options
| Color | Light : Dark |
|---|---|
| Red | 3 : 4 |
| Blue | 5 : 3 |
| Green | 1 : 3 |
| Pink | 1 : 7 |
| Yellow | 9 : 5 |
| Orange | 7 : 9 |
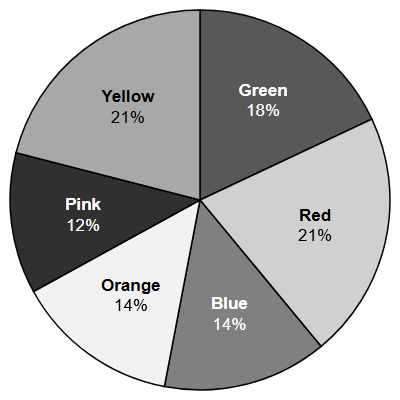
In a box, there are several balls. The pie-chart shows the percentage-wise distribution of 6 different colours of balls; and total number of balls = 1000. Also, the ratio of the light and dark shades of the six colours of balls is given.
What is the total percentage of orange, yellow and pink balls in the box?
- 46
- 47
- 48
- 49
Answer and explanation
Correct answer: B - 47
Orange 14% + Yellow 21% + Pink 12% = 47%. As a check, green (18%), red (21%) and blue (14%) make up the remaining 53%, and 47% + 53% = 100%.
Practice for these exams
-
JIPMAT
Related question papers
Related exam syllabi
More solved explanations in Data interpretation
- The pie-chart provided below gives the distribution of land areas used for various food crops : Choose the correct option from the following which uses more than…
- The following Pie-Chart indicates the monthly domestic budget of a family where A = Food, B = Conveyance, C = Clothing, D = House rent, E = Miscellaneous expenses,…
- Degree wise Break-up of Expenditure of a Family in a Month: Total amount spent in a month = ₹45,800 What is the total amount spent by the family on Entertainment…
- Directions: Study the following pie charts carefully and answer this question. It consists of data on admissions to graduate and postgraduate courses in different…
- Study the given table and answer the question that follows: Total Number of Faculties in Different Departments of an Institute and Percentage of Females and males.…