
ColorLight : Dark Red 3 : 4 Blue 5 : 3 Green 1 : 3 Pink 1 : 7 Yellow 9 : 5 Orange 7 : 9 In a box, there are several balls. The pie-chart shows the percentage-wise distribution of 6 different colours…
Question and options
| Color | Light : Dark |
|---|---|
| Red | 3 : 4 |
| Blue | 5 : 3 |
| Green | 1 : 3 |
| Pink | 1 : 7 |
| Yellow | 9 : 5 |
| Orange | 7 : 9 |
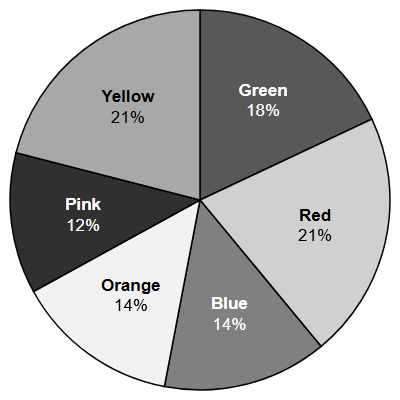
In a box, there are several balls. The pie-chart shows the percentage-wise distribution of 6 different colours of balls; and total number of balls = 1000. Also, the ratio of the light and dark shades of the six colours of balls is given.
What is the total number of green balls?
- 180
- 170
- 185
- 190
Answer and explanation
Correct answer: A - 180
Green = 18% of 1000 = 180. The light : dark ratio of 1 : 3 splits these into 45 light and 135 dark balls; the total counts both shades.
Practice for these exams
-
JIPMAT
Related question papers
Related exam syllabi
More solved explanations in Data interpretation
- Study the following table and answer the question given below : Classification of 100 students based on the marks obtained by them in Physics and Chemistry in an…
- Answer the question on the basis of the information given below : Three different climatic factors for four cities in India are shown in the following table : City…
- Degree wise Break-up of Expenditure of a Family in a Month: Total amount spent in a month = ₹45,800 What is the ratio of the amount spent by the family on medical…
- Read the passage and answer the question. A survey was conducted about the population of a particular region having working population of three lacs and…
- Degree wise Break-up of Expenditure of a Family in a Month: Total amount spent in a month = ₹45,800 What is the total amount spent by the family on Entertainment…