
The pie chart shows the percentage of total number of students (male and female) in different institutes affiliated with an educational council, whereas the radar graph shows the number of male…
Question and options
The pie chart shows the percentage of total number of students (male and female) in different institutes affiliated with an educational council, whereas the radar graph shows the number of male students in the institutes. Let the total number of students in all the institutes taken together be 5500
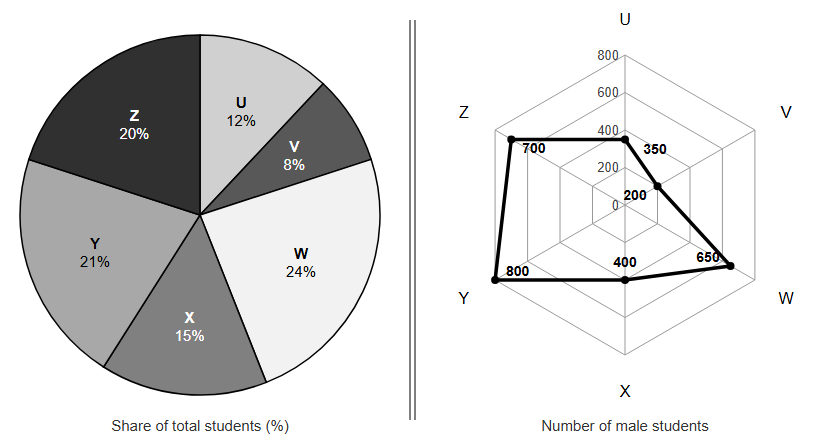
The number of female candidates in institution Y is:
- 310
- 355
- 425
- 400
Answer and explanation
Correct answer: B - 355
Y total = 21% of 5500 = 1155; males in Y (radar) = 800; females = 1155 - 800 = 355.
Practice for these exams
-
IIM Bangalore BBA DBE Entrance Test
Related question papers
Related exam syllabi
More solved explanations in Data interpretation
- Read the passage and answer the question. Answer the question based on the information given in the following table. A, B, C, D and E denote companies, and 2006,…
- Read the passage and answer the question. Players are selected for Judo based on their body weights from the following 10 weight groups: Weight groupBody weight 1…
- Refer the following table and pie-graphs for Question Nos. 119 and 120. Automobile Exports from India (in thousands) Type 2010-11 2011-12 2012-13 2013-14 Two…
- The following table shows the number of employees and their median age in eight companies located in a district. CompanyNumber of employeesMedian age A 32 24 B 28…
- In the following pie chart, the percentage distribution of the expenditure incurred in publishing a book is given – If for a certain quantity of books, the…