
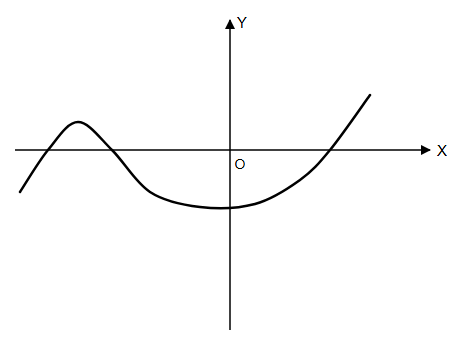
The graph of a polynomial \(y = f(x)\) is shown in the given figure, then the number of its zeros is:
Question and options
The graph of a polynomial is shown in the given figure, then the number of its zeros is:
- 4
- 3
- 2
- 1
Answer and explanation
Correct answer: B - 3
The curve crosses the x-axis three times (twice on the left, around its local maximum, and once on the positive x side), so it has 3 zeros.
Practice for these exams
-
JIPMAT