
The following pie chart shows the percentage share of value-wise sales of five brands A, B, C, D, and E in 2005. Considering sale of A increased by 50% in 2006, sale of E increased by 10% and all…
Question and options
The following pie chart shows the percentage share of value-wise sales of five brands A, B, C, D, and E in 2005.
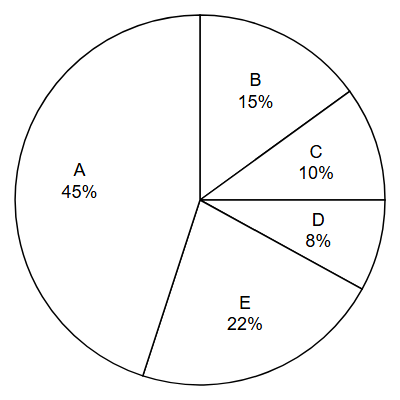
Considering sale of A increased by 50% in 2006, sale of E increased by 10% and all other brands had no change in sales. Total sales in 2006 was 2,16,000. What was the sale of A in 2005 (approximately)?
- 1,23,000
- 1,08,600
- 77,947
- 1,16,920
Answer and explanation
Correct answer: C - 77,947
2006 total = 1.247 * (2005 total), so 2005 total = 216000/1.247 = 1,73,216. A in 2005 = 45% of that = 77,947.
Practice for these exams
-
JIPMAT
Related question papers
Related exam syllabi
More solved explanations in Data interpretation
- The table shows the expenditure of three businessmen X, Y and Z. Values are in units of ₹10,000. YearXYZ 2017 173 191 150 2018 163 187 190 2019 247 263 249 If the…
- The following is the data pertaining to four movies which have collected gross revenues in domestic and international markets in Million USD ($). Arrange them in…
- Directions: Study the following table carefully and answer this question. It consists of the breakup of the expenses of a company over different years.…
- The table shows the number of goods of different categories sold in a city over the years (in thousands). YearTVRefrigeratorMicrowaveLaptopsCell phones 201026 64…
- Read the passage and answer the question. Answer the question based on the information given in the following table. A, B, C, D and E denote companies, and 2006,…