
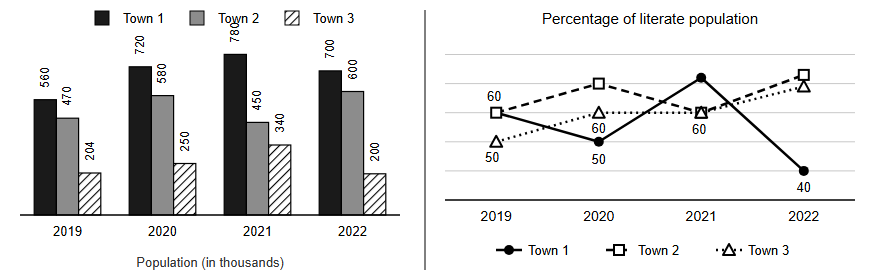
Population of three towns (in thousands) in four years given in bar graph and percentage of literate population of the towns given in line graph (some of the data is missing in the line graph).…
Question and options
Population of three towns (in thousands) in four years given in bar graph and percentage of literate population of the towns given in line graph (some of the data is missing in the line graph).
Following Table shows partial data of Percentage growth rate of literate population (year over
year)
What was the approximate literate population in town 2 in 2020?
Following Table shows partial data of Percentage growth rate of literate population (year over
year)
| Town 1 | Town 2 | Town 3 | |
|---|---|---|---|
| 2020 | (50/7)% | --- | --- |
| 2021 | (155/3)% | - (6800/203)% | 36% |
| 2022 | --- | (200/3)% | - (1600/51)% |
What was the approximate literate population in town 2 in 2020?
- 415000
- 398000
- 406000
- 422000
Answer and explanation
Correct answer: C - 406000
Town 2 2021 literate = 60% of 450k = 270k. 2021 growth = -(6800/203)% = -68/203, so 2020 literate = 270 / (1 - 68/203) = 270 x 203/135 = 406k = 406000 (consistent with the chart: 70% of 580k).
Practice for these exams
-
IIM Bangalore BBA DBE Entrance Test
Related question papers
Related exam syllabi
More solved explanations in Data interpretation
- Answer the question based on the data given in the table below: Gender \ Performance Number of Students Average Good Excellent Total Male 10 Female 32 Total 30…
- Cost of sugar in a month under the heads raw materials, labour, direct production and others were 12, 20, 35 and 23 units respectively, then the difference between…
- The diagram indicates the number of students taking different subjects. Which subject was taken by the largest number of students?
- Read the passage and answer the question. Automobiles are the most preferred mode of transport because they allow us to cover large distance quickly. Resultantly,…
- Following expenditure was incurred by a company under different heads: Year Salary Cost of components Power Interest Taxes 2000 288 296 26.4 12.2 32.0 2001 299 332…