
ColorLight : Dark Red 3 : 4 Blue 5 : 3 Green 1 : 3 Pink 1 : 7 Yellow 9 : 5 Orange 7 : 9 In a box, there are several balls. The pie-chart shows the percentage-wise distribution of 6 different colours…
Question and options
| Color | Light : Dark |
|---|---|
| Red | 3 : 4 |
| Blue | 5 : 3 |
| Green | 1 : 3 |
| Pink | 1 : 7 |
| Yellow | 9 : 5 |
| Orange | 7 : 9 |
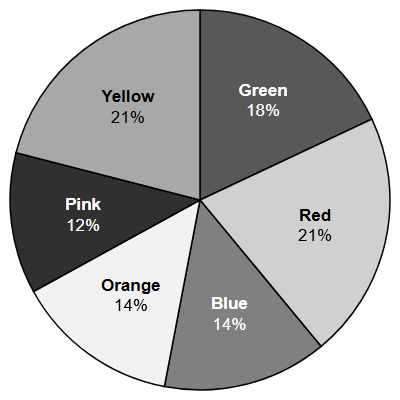
In a box, there are several balls. The pie-chart shows the percentage-wise distribution of 6 different colours of balls; and total number of balls = 1000. Also, the ratio of the light and dark shades of the six colours of balls is given.
What is the difference between number of light red balls and number of dark yellow balls?
- 15
- 12
- 17
- 14
Answer and explanation
Correct answer: A - 15
Light red = 3/7 x 210 = 90; yellow = 210, dark yellow = 5/14 x 210 = 75. Difference = 15.
Practice for these exams
-
JIPMAT
Related question papers
Related exam syllabi
More solved explanations in Data interpretation
- The pie chart shows the percentage of total number of students (male and female) in different institutes affiliated with an educational council, whereas the radar…
- Study the following table carefully and answer the question. The table illustrates the number of electric cars manufactured by a company over five years and the…
- Directions: Answer the question based on the information given. The rate of taxation in India has these slabs: Taxable Income (₹)Tax Rate 0–50,000 Exempt 50,000 –…
- Study the graph given below and answer the given question : The demand and production of tyres (in lakhs) in various years are as follows. In 2004, the quantity of…
- Directions: The bar graph shows the foreign exchange reserves of a country (in million US$) from 2008-09 to 2015-16. Answer the question based on this graph.…