
The pie chart shows the percentage of total number of students (male and female) in different institutes affiliated with an educational council, whereas the radar graph shows the number of male…
Question and options
The pie chart shows the percentage of total number of students (male and female) in different institutes affiliated with an educational council, whereas the radar graph shows the number of male students in the institutes. Let the total number of students in all the institutes taken together be 5500
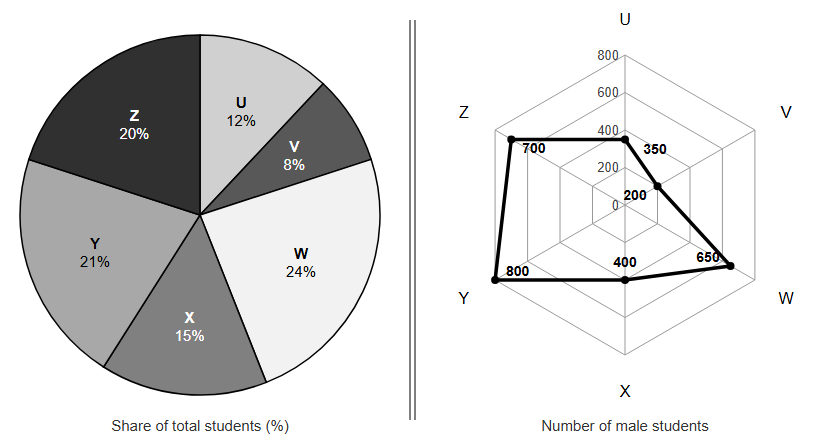
If 25% of the female students from institute V are transferred to institute Z and 20% of the male students from institute Z are transferred to institute W, then after the transfer, the percentage (up to two decimal places) by which the number of students in institute Z are more than that of the students in institute U is _____.
- 60.45%
- 50.63%
- 49.09%
- 54.55%
Answer and explanation
Correct answer: D - 54.55%
Totals: Z = 20% of 5500 = 1100 (700 M, 400 F); V = 440 (200 M, 240 F); U = 660. 25% of V's females = 60 move into Z; 20% of Z's males = 140 leave. New Z = 1100 + 60 - 140 = 1020. (1020 - 660)/660 = 54.55%.
Practice for these exams
-
IIM Bangalore BBA DBE Entrance Test
Related question papers
Related exam syllabi
More solved explanations in Data interpretation
- Directions: Read the information given and answer the question. (i) There is a group of seven persons A, B, C, D, E, F and G. (ii) There are four males, three…
- Directions: Study the bar graph given below and answer this question. What is the average sales turnover during all the years (₹ in crores)?
- The following pie chart shows the monthly domestic budget of a family: A20%B15%C18%D20%E12%F where A = Food; B = Conveyance; C = Clothing; D = House Rent; E =…
- Directions: The table shows the number of new employees added to different categories of employees in a company and also the number of employees from these…
- The following table provides the details of monthly sales (in lakhs of rupees) and the value of products returned by the customers (as a percentage of sales) of an…