
Analyze the given data for exports and imports of rubber in Rs. crores from 2006 to 2017 and answer the question based on the analysis. Balance of trade is defined as imports subtracted from exports…
Question and options
Analyze the given data for exports and imports of rubber in Rs. crores from 2006 to 2017 and answer the question based on the analysis.
Balance of trade is defined as imports subtracted from exports ( = exports - imports). Which of the following blocks of three years has witnessed the largest average negative balance of trade?
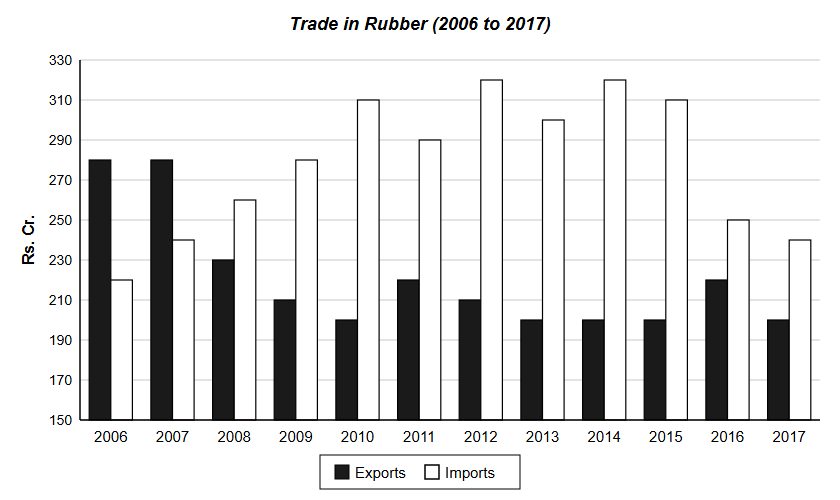
Balance of trade is defined as imports subtracted from exports ( = exports - imports). Which of the following blocks of three years has witnessed the largest average negative balance of trade?
- 2007-2009
- 2015-2017
- 2014-2016
- 2010-2012
Answer and explanation
Correct answer: D - 2010-2012
Average (exports-imports): 2007-09 = (40-30-70)/3 = -20; 2015-17 = (-110-30-40)/3 = -60; 2014-16 = (-120-110-30)/3 = -86.7; 2010-12 = (-110-70-110)/3 = -96.7. Largest negative is 2010-2012.
Practice for these exams
-
IPMAT Indore
Related question papers
Related exam syllabi
More solved explanations in Data interpretation
- Directions: Study the following pie charts carefully and answer this question. It consists of data on admissions to graduate and postgraduate courses in different…
- The food values and the unit price of a number of food items are given below :Food% of protein% of carbohydrate% of fatsCost per 100 gms (₹) A 10 20 30 1.80 B 20…
- ColorLight : Dark Red 3 : 4 Blue 5 : 3 Green 1 : 3 Pink 1 : 7 Yellow 9 : 5 Orange 7 : 9 In a box, there are several balls. The pie-chart shows the percentage-wise…
- Directions: Study the following table carefully and answer this question. It consists of the breakup of the expenses of a company over different years.…
- ColorLight : Dark Red 3 : 4 Blue 5 : 3 Green 1 : 3 Pink 1 : 7 Yellow 9 : 5 Orange 7 : 9 In a box, there are several balls. The pie-chart shows the percentage-wise…