
CUSAT CAT Five-Year LL.B. Quantitative Aptitude & Data Interpretation (Passage-based Questions) Previous Year Questions
Try the preview and open any solution for a worked explanation.
CUSAT CAT Five-Year LL.B. practice pack
The practice pack for CUSAT CAT Five-Year LL.B. is coming soon to LawMint.
Question 1
Directions: Study the figure on the professors and their subjects and answer the question:
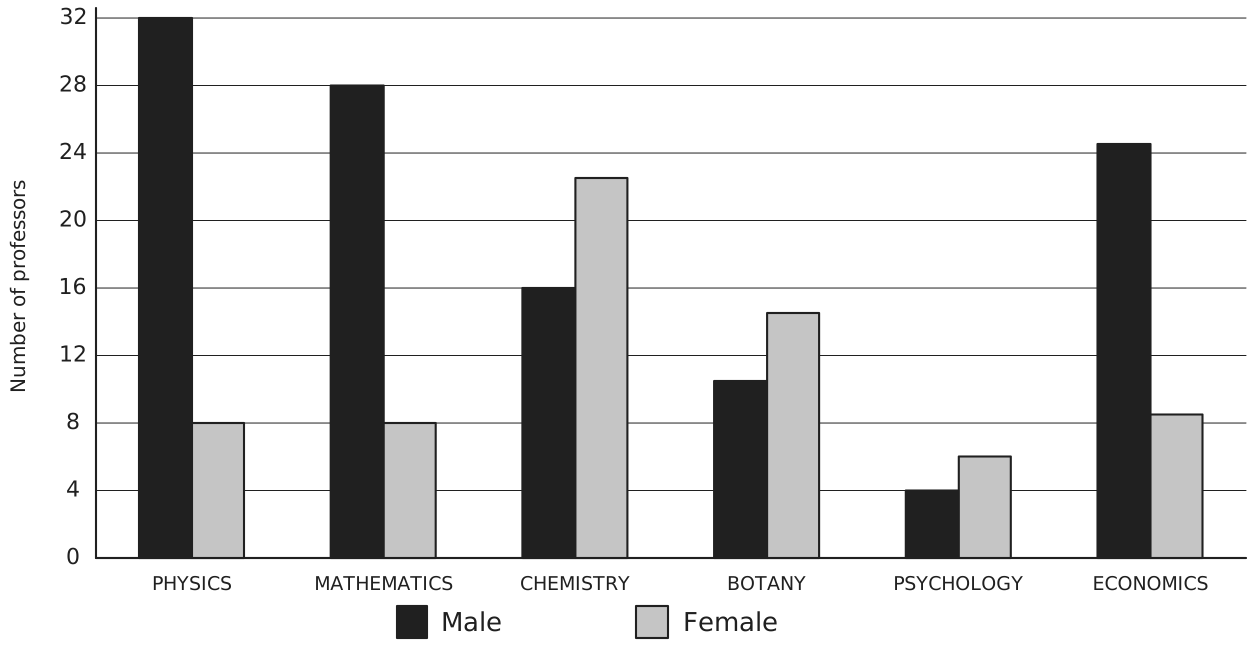
Which one of the following disciplines has the highest ratio of males to females professors?
Correct answer: A - Physics
View full solution
Question 2
Directions: Study the figure on the professors and their subjects and answer the question:
What percentage of all Psychology professors are females?
Correct answer: C - 60%
View full solution
Question 3
Directions: Study the figure on the professors and their subjects and answer the question:
If the Psychology professors in the University constitute 2% of all the professors in the University, then what is the number of professors in the University?
Correct answer: B - 500
View full solution
Question 4
A series is given with one term missing. Choose the correct alternative from the given ones that will complete the series.
135, 226, 353, ?, 739
Correct answer: B - 522
View full solution
Question 5
A series is given with one term missing. Choose the correct alternative from the given ones that will complete the series.
4, 7, 13, 22, 34, ?
Correct answer: A - 49
View full solution
Question 6
A series is given with one term missing. Choose the correct alternative that will complete the series.
2, 1, , , ?
Correct answer: D - \(\frac{1}{8}\)
View full solution
Question 7
A series is given with one term missing. Choose the correct alternative that will complete the series.
7, 10, 8, 11, 9, 12, ?
Correct answer: C - 10
View full solution
Question 8
A series is given with one term missing. Choose the correct alternative that will complete the series.
36, 34, 30, 28, 24, ?
Correct answer: B - 22
View full solution
Question 9
Answer the question after studying the following table depicting the number of students graduating in B.Sc., B.Com. and B.A. in six different cities A, B, C, D, E and F. Your answers must be based on the data given in the table alone.
| City | B.Sc. | B.Com. | B.A. |
|---|---|---|---|
| A | 220 | 120 | 241 |
| B | 145 | 231 | 524 |
| C | 210 | 784 | 200 |
| D | 365 | 451 | 120 |
| E | 874 | 541 | 320 |
| F | 258 | 215 | 450 |
What is the average number of students studying B.Sc. across the six cities?
Correct answer: C - 345
View full solution
Question 10
Answer the question after studying the following table depicting the number of students graduating in B.Sc., B.Com. and B.A. in six different cities A, B, C, D, E and F. Your answers must be based on the data given in the table alone.
| City | B.Sc. | B.Com. | B.A. |
|---|---|---|---|
| A | 220 | 120 | 241 |
| B | 145 | 231 | 524 |
| C | 210 | 784 | 200 |
| D | 365 | 451 | 120 |
| E | 874 | 541 | 320 |
| F | 258 | 215 | 450 |
What percentage of students in city A study B.Com.?
Correct answer: B - 21
View full solution
Previous papers with Quantitative Aptitude & Data Interpretation questions
CUSAT CAT Five-Year LL.B. practice pack
The practice pack for CUSAT CAT Five-Year LL.B. is coming soon to LawMint.