
Quantitative Aptitude & Data Interpretation MCQs with Answers
Try the topic preview and open any solution for a worked explanation.
Question 1
Read the passage and answer the question.
The following data presents the cases of Japanese Encephalitis in five states of India.
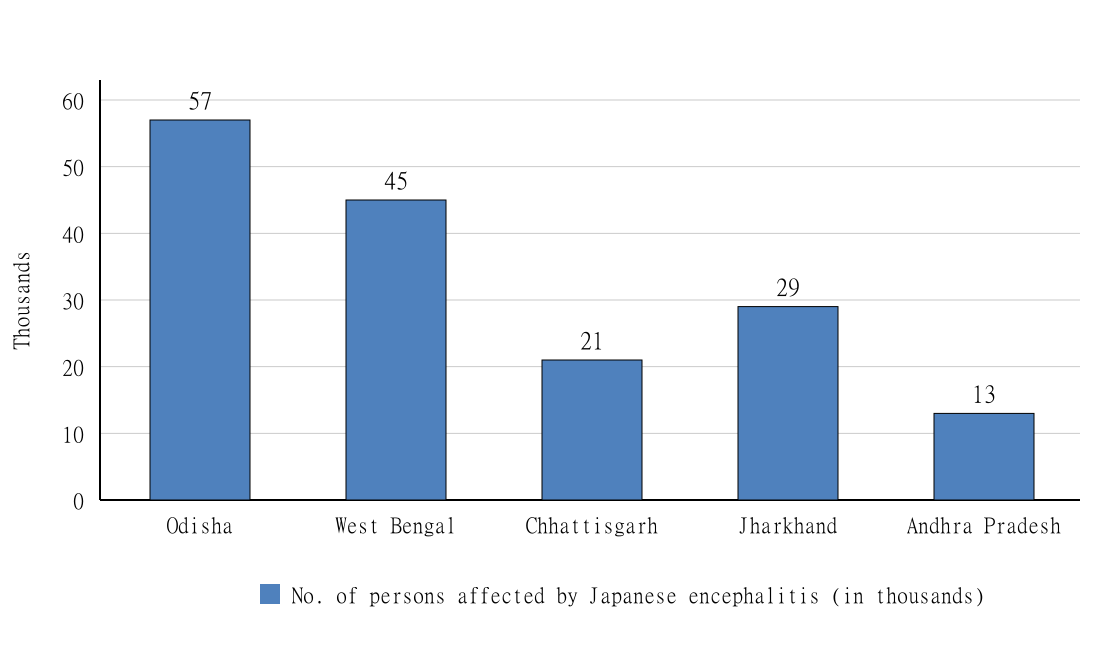
Values in the bar chart (number of persons affected, in thousands): Odisha 57, West Bengal 45, Chhattisgarh 21, Jharkhand 29, Andhra Pradesh 13.
| States | Ratio of males to females |
|---|---|
| Male : Female | |
| Odisha | 12 : 7 |
| West Bengal | 6 : 3 |
| Chhattisgarh | 5 : 2 |
| Jharkhand | 15 : 14 |
| Andhra Pradesh | 7 : 6 |
Number of females affected by Japanese encephalitis in West Bengal are what percentage (up to 1 decimal) more or less than that of females affected in Odisha?
Question 2
Read the passage and answer the question.
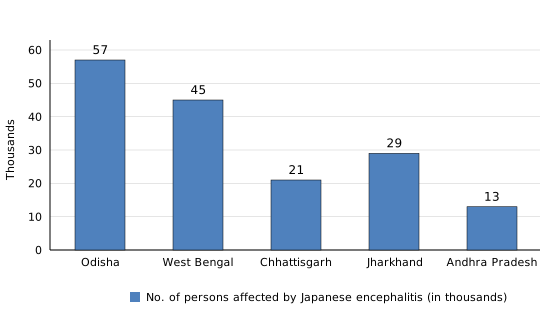
The following data presents the cases of Japanese Encephalitis in five states of India.
Values in the bar chart (number of persons affected, in thousands): Odisha 57, West Bengal 45, Chhattisgarh 21, Jharkhand 29, Andhra Pradesh 13.
| States | Ratio of males to females |
|---|---|
| Male : Female | |
| Odisha | 12 : 7 |
| West Bengal | 6 : 3 |
| Chhattisgarh | 5 : 2 |
| Jharkhand | 15 : 14 |
| Andhra Pradesh | 7 : 6 |
By what percentage is the average of males in Chhattisgarh, Jharkhand and Andhra Pradesh together more or less than the average of females in West Bengal, Jharkhand and Odisha together who are affected by Japanese encephalitis?
Question 3
Read the passage and answer the question.
The following data presents the cases of Japanese Encephalitis in five states of India.
Values in the bar chart (number of persons affected, in thousands): Odisha 57, West Bengal 45, Chhattisgarh 21, Jharkhand 29, Andhra Pradesh 13.
| States | Ratio of males to females |
|---|---|
| Male : Female | |
| Odisha | 12 : 7 |
| West Bengal | 6 : 3 |
| Chhattisgarh | 5 : 2 |
| Jharkhand | 15 : 14 |
| Andhra Pradesh | 7 : 6 |
What is the percentage (up to 1 decimal) of females affected by ‘Japanese encephalitis’ of the total affected population across five states?
Question 4
Read the passage and answer the question.
In the figure given below, a goat is tied to a pole (at point O) which is the center of the semi-circular plot. The area of the plot is equal to its perimeter. BO is the length of the rope through which the goat is tied to the pole. Answer to the closest decimal.
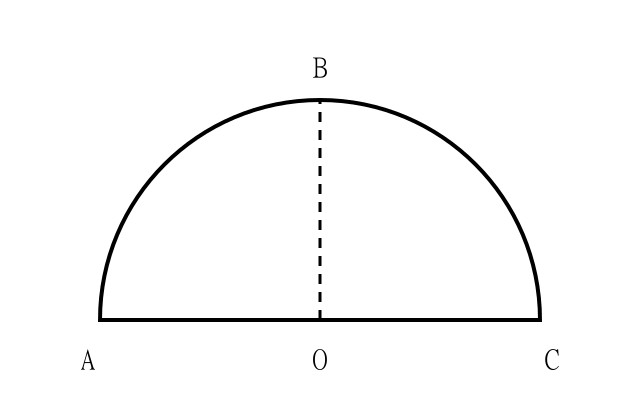
If a triangle is created by joining points A, B, and C, what will be the length of AB?
Question 5
Read the passage and answer the question.
In the figure given below, a goat is tied to a pole (at point O) which is the center of the semi-circular plot. The area of the plot is equal to its perimeter. BO is the length of the rope through which the goat is tied to the pole. Answer to the closest decimal.
A triangle is created by joining points A, B and C. What will be the area of the triangle ABC?
Question 6
Read the passage and answer the question.
The data below represents the State-wise Literacy Rate of 10 states, in percentages. Use the data to answer the question.
| States/Union Territories | 1971 | 1981 | 1991 | 2001 | 2011 |
|---|---|---|---|---|---|
| Andhra Pradesh | 24.57 | 35.66 | 44.08 | 60.47 | 67.02 |
| Arunachal Pradesh | 11.29 | 25.55 | 41.59 | 54.34 | 65.39 |
| Bihar | 23.17 | 32.32 | 37.49 | 47.00 | 61.80 |
| Goa | 51.96 | 65.71 | 75.51 | 82.01 | 88.70 |
| Jharkhand | 23.87 | 35.03 | 41.39 | 53.56 | 66.41 |
| Kerala | 69.75 | 78.85 | 89.81 | 90.86 | 94.00 |
| Lakshadweep | 51.76 | 68.42 | 81.78 | 86.66 | 91.85 |
| Mizoram | 53.80 | 59.88 | 82.26 | 88.80 | 91.33 |
| Rajasthan | 22.57 | 30.11 | 38.55 | 60.41 | 66.11 |
| Tripura | 30.98 | 50.10 | 60.44 | 73.19 | 87.22 |
In how many states did the literacy rate increase by less than 10 percentage points between the years 2001 and 2011? In percentage terms, what was the increase in literacy rate for the state that saw the lowest increase in literacy rate from 2001 to 2011?
Question 7
Read the passage and answer the question.
Two renowned international Software companies, namely Pollaris and Contigent, started their business in the year 2007 and both the companies were in competition with each other in profit making. Pollaris earned 30 per cent profit in the year 2007 and 2008, and further increased it to 40 per cent in 2009. However, its profit percentage decreased to 20 per cent in the year 2010. On the other hand, Contigent opened with 40 per cent profit in 2007, but slowly decreased to 35 per cent in 2008 and 30 per cent in 2009. Interestingly, both the companies increased their profit percentage in the later year considerably. Pollaris increased its profit percentage to 35 per cent in 2011 and 50 per cent in 2012; simultaneously, Contigent increased its profit percentage to 45 per cent in 2010, 50 per cent in 2011 and reached 60 per cent in the year 2012. As there is a need to understand the income and expenditure for the better performance of both companies in the future, answer the following questions.
If the income of Contigent Company in 2008 was ₹ 200 crores, what was its profit in 2009?
Question 8
Read the passage and answer the question.
Players are selected for Judo based on their body weights from the following 10 weight groups:
| Weight group | Body weight |
|---|---|
| 1 | 48 kg – 52 kg |
| 2 | 52 kg – 56 kg |
| 3 | 56 kg – 60 kg |
| 4 | 60 kg – 64 kg |
| 5 | 64 kg – 68 kg |
| 6 | 68 kg – 72 kg |
| 7 | 72 kg – 76 kg |
| 8 | 76 kg – 80 kg |
| 9 | 80 kg – 84 kg |
| 10 | 84 kg – 88 kg |
The average weight of the players after selecting one player from each group is 68 kg. If one of the players (named S) leaves the team, their average weight comes down to 66.5 kg.
Taking all the players in the ten weight groups together (not only the players selected for the team), which group contributes most to the overall average?
Question 9
According to the estimates of the World Inequality Report 2022, in India, men earn 82 percent of the labour income, whereas women earn 18 percent of it. A woman agriculture field labourer makes Rs. 88 per day lesser than her male counterpart, according to the Ministry of Agriculture's data for 2020-21. While a man is paid Rs. 383 a day on an average, a woman makes a mere Rs. 294 a day. The gap in their daily wages is more than the cost of two kilograms of rice. This gap differs from State to State. Field laborers, for instance, make the most money in Kerala. While a man gets Rs. 789 per day, a woman is paid Rs. 537. While this is the highest amount paid to a woman labourer in a State, it is also Rs. 252 lesser than what her male counterpart was paid. As of 2020-21, Tamil Nadu has the highest gender wage gap among agriculture field laborers at 112 per cent. It is followed by Goa (61 percent) and Kerala. The wage gap is the lowest in Jharkhand and Gujarat (6 percent each), but the women laborers there get paid just Rs. 239 and Rs. 247 per day, respectively.
Men earn more than women across all forms of work, the gap greatest for the self-employed. In 2023, male self-employed workers earned 2.8 times that of women. In contrast, male regular wage workers earned 24% more than women and male casual workers earned 48% more. The gender gap in earnings is still a persistent phenomenon. However, there are differences in trends. The gender gap has increased for self-employed workers, while falling for regular wage workers. Male regular wage workers earned 34% more than women from 2019 to 2022, with the gap falling to 24% in 2023.
If the wages paid to men working in the agricultural sector in Goa are Rs. 335 per day on an average, and men in Goa earn 61% more than women, what is the amount of wages paid to women in the region?
Question 10
According to the estimates of the World Inequality Report 2022, in India, men earn 82 percent of the labour income, whereas women earn 18 percent of it. A woman agriculture field labourer makes Rs. 88 per day lesser than her male counterpart, according to the Ministry of Agriculture's data for 2020-21. While a man is paid Rs. 383 a day on an average, a woman makes a mere Rs. 294 a day. The gap in their daily wages is more than the cost of two kilograms of rice. This gap differs from State to State. Field laborers, for instance, make the most money in Kerala. While a man gets Rs. 789 per day, a woman is paid Rs. 537. While this is the highest amount paid to a woman labourer in a State, it is also Rs. 252 lesser than what her male counterpart was paid. As of 2020-21, Tamil Nadu has the highest gender wage gap among agriculture field laborers at 112 per cent. It is followed by Goa (61 percent) and Kerala. The wage gap is the lowest in Jharkhand and Gujarat (6 percent each), but the women laborers there get paid just Rs. 239 and Rs. 247 per day, respectively.
Men earn more than women across all forms of work, the gap greatest for the self-employed. In 2023, male self-employed workers earned 2.8 times that of women. In contrast, male regular wage workers earned 24% more than women and male casual workers earned 48% more. The gender gap in earnings is still a persistent phenomenon. However, there are differences in trends. The gender gap has increased for self-employed workers, while falling for regular wage workers. Male regular wage workers earned 34% more than women from 2019 to 2022, with the gap falling to 24% in 2023.
If the wages paid to men working in the agricultural sector in Goa are Rs. 335 per day on an average (which is 61% more than what women are paid), which of the following states offers the least wages to women workers in the agricultural sector?
Practise for these exams
-
CLAT UG
-
Common Management Admission Test (CMAT)
-
CUSAT CAT Five-Year LL.B.