
Common Management Admission Test (CMAT) Quantitative Aptitude & Data Interpretation (Passage-based Questions) Previous Year Questions
Try the preview and open any solution for a worked explanation.
Common Management Admission Test (CMAT) practice pack
The practice pack for Common Management Admission Test (CMAT) is coming soon to LawMint.
Question 1
The table given below represents the number of cars sold by four dealers P, Q, R and S in six months of a given year. Based on the given data, answer the question that follows.
| Month | P | Q | R | S | Total |
|---|---|---|---|---|---|
| January | 102 | 92 | 95 | 107 | 396 |
| February | 94 | 96 | 104 | 106 | 400 |
| March | 85 | 94 | 100 | 90 | 369 |
| April | 108 | 97 | 99 | 96 | 400 |
| May | 98 | 102 | 100 | 89 | 389 |
| June | 95 | 108 | 102 | 91 | 396 |
What is the ratio of the total number of cars sold by dealer P in February, April and May to the total number of cars sold by dealer S in March, May and June?
Question 2
The table given below represents the number of cars sold by four dealers P, Q, R and S in six months of a given year. Based on the given data, answer the question that follows.
| Month | P | Q | R | S | Total |
|---|---|---|---|---|---|
| January | 102 | 92 | 95 | 107 | 396 |
| February | 94 | 96 | 104 | 106 | 400 |
| March | 85 | 94 | 100 | 90 | 369 |
| April | 108 | 97 | 99 | 96 | 400 |
| May | 98 | 102 | 100 | 89 | 389 |
| June | 95 | 108 | 102 | 91 | 396 |
The total number of cars sold by dealer P from February to June is what percent more than the total number of cars sold by all the dealers in June?
Question 3
The table given below represents the number of cars sold by four dealers P, Q, R and S in six months of a given year. Based on the given data, answer the question that follows.
| Month | P | Q | R | S | Total |
|---|---|---|---|---|---|
| January | 102 | 92 | 95 | 107 | 396 |
| February | 94 | 96 | 104 | 106 | 400 |
| March | 85 | 94 | 100 | 90 | 369 |
| April | 108 | 97 | 99 | 96 | 400 |
| May | 98 | 102 | 100 | 89 | 389 |
| June | 95 | 108 | 102 | 91 | 396 |
The total number of cars sold by dealer Q in April, May and June is what percent of the total number of cars sold by all the dealers in February and April?
Question 4
Study the bar graph below carefully and answer the question. The bar graph shows the number of packets of bread of two types, multigrain and whole-wheat, sold by five stores A, B, C, D and E.
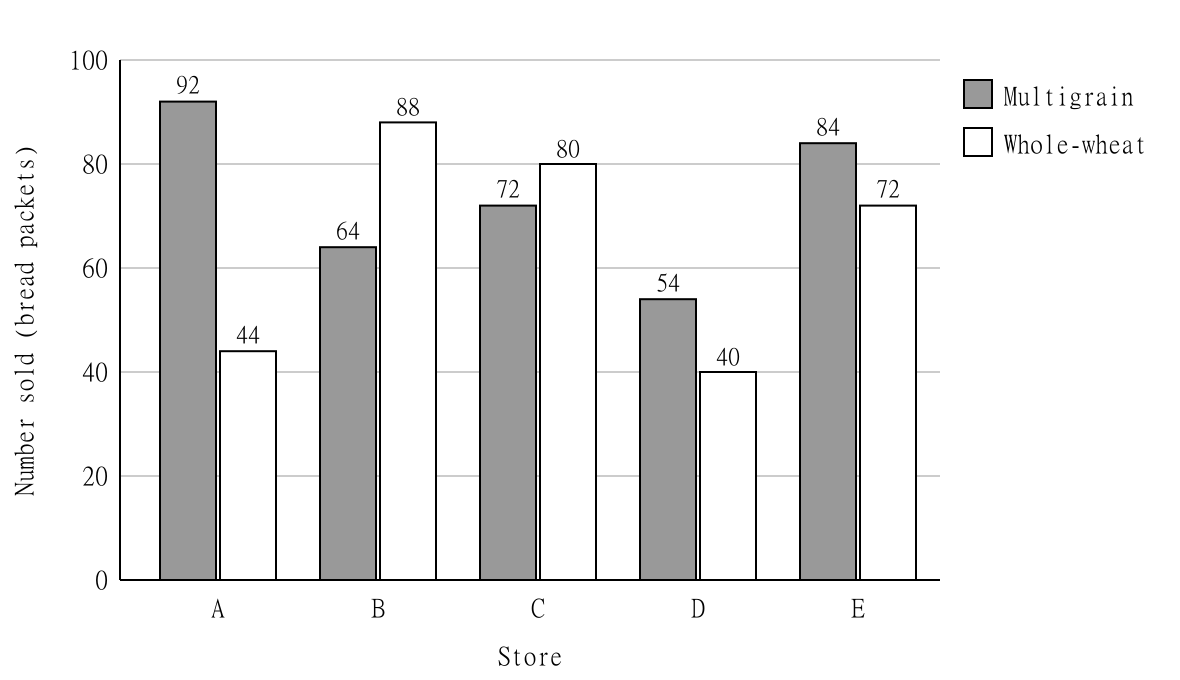
Another store F sold a number of multigrain packets equal to the average number of multigrain packets sold by stores C, D and E, and a number of whole-wheat packets equal to the average number of whole-wheat packets sold by stores A and E. If store B sold each packet at ₹ 240 and store F sold each packet at 20% more than store B, what is the total revenue collected by store F?
Question 5
Study the bar graph below carefully and answer the question. The bar graph shows the number of packets of bread of two types, multigrain and whole-wheat, sold by five stores A, B, C, D and E.
The total number of packets sold by store C is approximately what percent more or less than the total number of packets sold by store E?
Question 6
Study the bar graph below carefully and answer the question. The bar graph shows the number of packets of bread of two types, multigrain and whole-wheat, sold by five stores A, B, C, D and E.
Multigrain packets sold by stores A and B together are what percent more or less than whole-wheat packets sold by stores C and D together?
Question 7
Study the pie charts below. They show the break-up of the number of students studying in different specialisations of a management college and the break-up of the number of students who recently got placed from each specialisation.
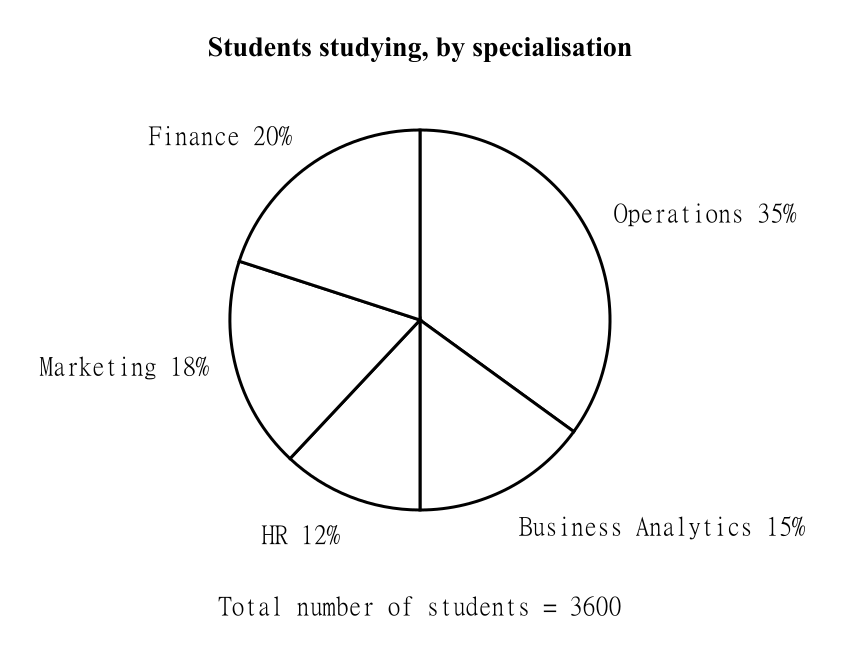
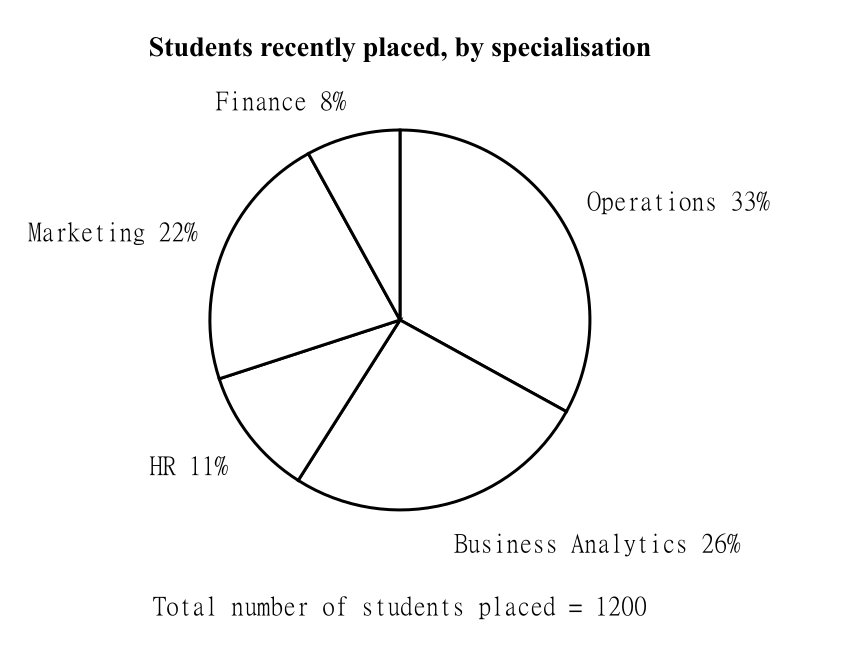
The total number of students who got placed from all the specialisations together was what percentage of the total number of students pursuing the Operations, Marketing and Finance specialisations together?
Question 8
Study the pie charts below. They show the break-up of the number of students studying in different specialisations of a management college and the break-up of the number of students who recently got placed from each specialisation.
What is the difference between the total number of students pursuing the Business Analytics and HR specialisations combined and the number of students who got placed from the Marketing and Finance specialisations combined?
Question 9
Study the pie charts below. They show the break-up of the number of students studying in different specialisations of a management college and the break-up of the number of students who recently got placed from each specialisation.
The number of students who got placed from the HR specialisation was what percent of the total number of students studying in that specialisation?
Question 10
Study the table and the pie chart and answer the question.
Six stores, A to F, together sold 84,000 kurtis (cotton and linen) in 2016. The pie chart shows how this total was distributed among the six stores. The table gives, for each store, the ratio of the number of linen kurtis to the number of cotton kurtis it sold.
| Store | Ratio of linen kurtis to cotton kurtis sold |
|---|---|
| A | 7 : 5 |
| B | 5 : 6 |
| C | 3 : 2 |
| D | 5 : 3 |
| E | 4 : 3 |
| F | 7 : 3 |
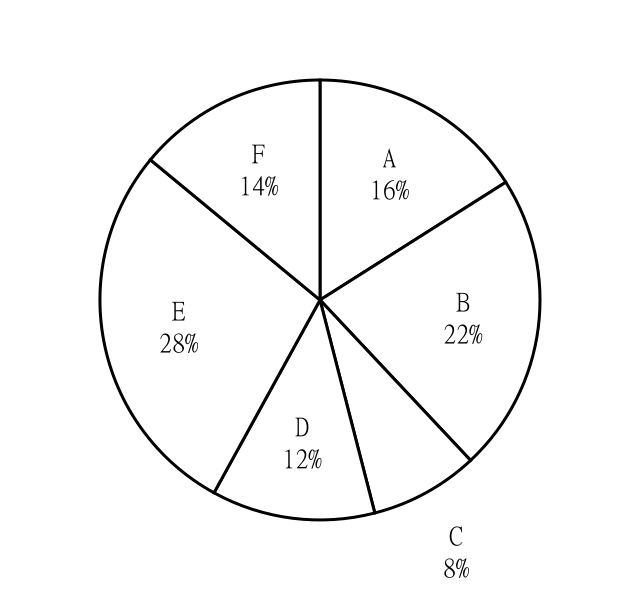
Distribution of the total number of kurtis (cotton and linen) sold by the six stores in 2016; total kurtis sold = 84,000.
The number of kurtis (linen and cotton) sold by store D is what percent more than the number of linen kurtis sold by store B?
Previous papers with Quantitative Aptitude & Data Interpretation questions
Common Management Admission Test (CMAT) practice pack
The practice pack for Common Management Admission Test (CMAT) is coming soon to LawMint.