
The pie chart shows the percentage of total number of students (male and female) in different institutes affiliated with an educational council, whereas the radar graph shows the number of male…
Question and options
The pie chart shows the percentage of total number of students (male and female) in different institutes affiliated with an educational council, whereas the radar graph shows the number of male students in the institutes. Let the total number of students in all the institutes taken together be 5500
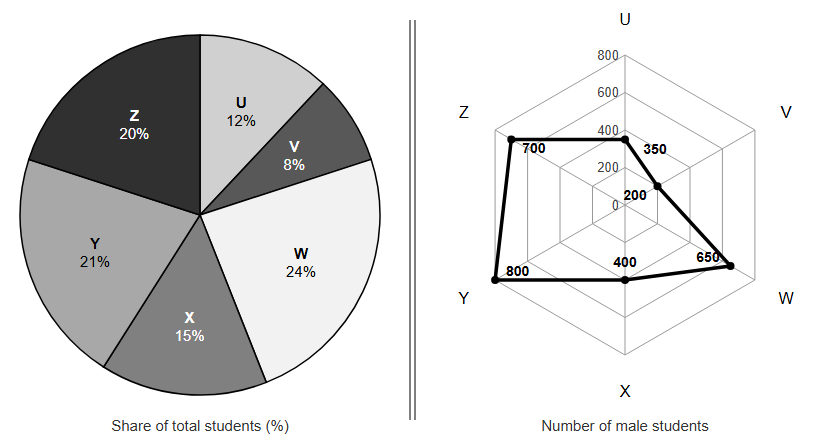
The ratio of the number of female students in institute Z to the number of female students in institute V is:
- 3 : 7
- 7 : 5
- 2 : 3
- 5 : 3
Answer and explanation
Correct answer: D - 5 : 3
Z females = 1100 - 700 = 400; V females = 440 - 200 = 240. Ratio 400:240 = 5:3.
Practice for these exams
-
IIM Bangalore BBA DBE Entrance Test
Related question papers
Related exam syllabi
More solved explanations in Data interpretation
- A result of a survey of 1000 students with respect to their knowledge of History (H), Geography (G) and Civics (C) is as follows: Geography only 200; History only…
- Instruction : Read carefully and answer the question in the light of the information given below : Following are the percentage distribution of the expenditure…
- The following table provides the details of monthly sales (in lakhs of rupees) and the value of products returned by the customers (as a percentage of sales) of an…
- Read the passage and answer the question. World fruit production went up 54 percent between 2000 and 2019, to 883 million tonnes. Five fruit species accounted for…
- The following table provides the details of monthly sales (in lakhs of rupees) and the value of products returned by the customers (as a percentage of sales) of an…