
The pie chart shows the percentage of total number of students (male and female) in different institutes affiliated with an educational council, whereas the radar graph shows the number of male…
Question and options
The pie chart shows the percentage of total number of students (male and female) in different institutes affiliated with an educational council, whereas the radar graph shows the number of male students in the institutes. Let the total number of students in all the institutes taken together be 5500
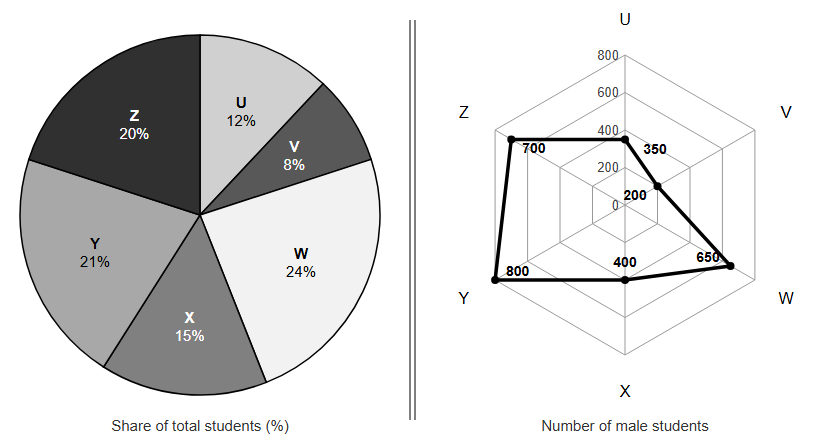
The degree representation of the total number of students in institutes X and Y, taken together, as a share of the overall number of students in all the institutes, taken together, is:
- 106°
- 79.5°
- 129.6°
- 36°
Answer and explanation
Correct answer: C - 129.6°
X + Y = 15% + 21% = 36% of all students; 0.36 x 360 = 129.6 degrees.
Practice for these exams
-
IIM Bangalore BBA DBE Entrance Test
Related question papers
Related exam syllabi
More solved explanations in Data interpretation
- The following Pie-charts show the percentage of different heads of expenditures of a company in the financial year 2023-24 and 2024-25. The total expenditure was ₹…
- The following pie-chart represents the total number of valid votes obtained by four students in a student election. The total number of valid votes polled was 720.…
- The following table gives the percentage of marks obtained by 6 students in 6 subjects in an examination. The numbers in brackets are the maximum marks in each…
- Directions: Study the bar graph given below and answer this question. Which year witnessed the maximum growth in sales turnover in absolute terms?
- Number of vehicles (in 100s) passing through toll plaza in September: Week Bus Truck Car I 28.3 15.4 40.2 II 24.5 12.3 36.1 III 20.4 14.2 42.9 IV 24.4 24.4 39.8…