
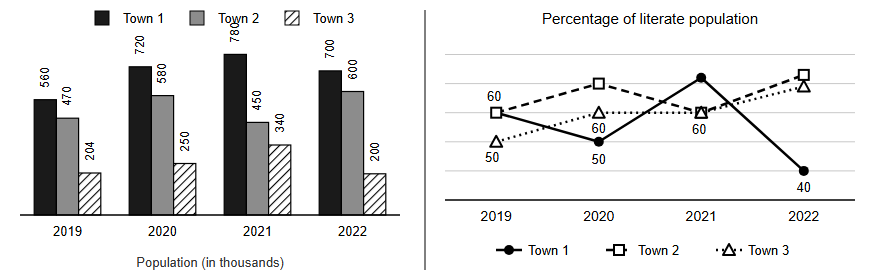
Population of three towns (in thousands) in four years given in bar graph and percentage of literate population of the towns given in line graph (some of the data is missing in the line graph).…
Question and options
Population of three towns (in thousands) in four years given in bar graph and percentage of literate population of the towns given in line graph (some of the data is missing in the line graph).
Following Table shows partial data of Percentage growth rate of literate population (year over
year)
What was the number of literate population in the year 2019 in town 1?
Following Table shows partial data of Percentage growth rate of literate population (year over
year)
| Town 1 | Town 2 | Town 3 | |
|---|---|---|---|
| 2020 | (50/7)% | --- | --- |
| 2021 | (155/3)% | - (6800/203)% | 36% |
| 2022 | --- | (200/3)% | - (1600/51)% |
What was the number of literate population in the year 2019 in town 1?
- 336000
- 393000
- 363000
- 339000
Answer and explanation
Correct answer: A - 336000
Town 1 2019 literate = 60% of 560k = 336k = 336000. Check with table: 2020 literate = 50% of 720k = 360k, and 336k x (1 + 50/700) = 360k.
Practice for these exams
-
IIM Bangalore BBA DBE Entrance Test
Related question papers
Related exam syllabi
More solved explanations in Data interpretation
- Directions: Study the pie-chart and table to answer the question based on them. Proportion of Population of Seven Villages in 2014 Z11%Y15%X16%V10%T21%S11%R16%…
- Directions: Study the bar diagram carefully and answer the question based on it. Birth Rate in Different Countries0510152025303540455055Birth rates per…
- Study the following table and answer the question given below : Classification of 100 students based on the marks obtained by them in Physics and Chemistry in an…
- The following graph shows Gross Traffic Receipts and Total Expenditure (in ₹) from 2015 to 2019 . In order to make a profit equal to \(10 \%\) of the gross traffic…
- Directions - The details of expenditure of monthly income of a family is given in the Pie chart. From this graphical data, answer question number 47 and 48 - How…