
Data interpretation MCQs with Answers
Try the topic preview and open any solution for a worked explanation.
Question 1
Which one of the following is not a source of data?
Question 2
The given table gives the percentage distribution of population of five states A, B, C, D, E on the basis of Education and also on the basis of sex. Study the table and answer the questions that follow.
| State | Percentage of Educated Population | Proportion of Males and Females | |
|---|---|---|---|
| (10 + 2 Category) | (Graduate Category) | ||
| A | 60 | 5:6 | 5:3 |
| B | 50 | 5:5 | 5:2 |
| C | 35 | 5:3 | 4:3 |
| D | 45 | 6:5 | 4:2 |
| E | 41 | 4:3 | 3:2 |
Suppose the population of State A is 1 million, count the number of graduate females in State A.
Question 3
The given table gives the percentage distribution of population of five states A, B, C, D, E on the basis of Education and also on the basis of sex. Study the table and answer the questions that follow.
| State | Percentage of Educated Population | Proportion of Males and Females | |
|---|---|---|---|
| (10 + 2 Category) | (Graduate Category) | ||
| A | 60 | 5:6 | 5:3 |
| B | 50 | 5:5 | 5:2 |
| C | 35 | 5:3 | 4:3 |
| D | 45 | 6:5 | 4:2 |
| E | 41 | 4:3 | 3:2 |
If the male population in the 10 + 2 category is 2 million in State B, then the total population of State B is
Question 4
The given table gives the percentage distribution of population of five states A, B, C, D, E on the basis of Education and also on the basis of sex. Study the table and answer the questions that follow.
| State | Percentage of Educated Population | Proportion of Males and Females | |
|---|---|---|---|
| (10 + 2 Category) | (Graduate Category) | ||
| A | 60 | 5:6 | 5:3 |
| B | 50 | 5:5 | 5:2 |
| C | 35 | 5:3 | 4:3 |
| D | 45 | 6:5 | 4:2 |
| E | 41 | 4:3 | 3:2 |
What will be the difference between the male population in the (10 + 2) category and the male population in the Graduate category if the total population of State C is 4 million.
Question 5
The given table gives the percentage distribution of population of five states A, B, C, D, E on the basis of Education and also on the basis of sex. Study the table and answer the questions that follow.
| State | Percentage of Educated Population | Proportion of Males and Females | |
|---|---|---|---|
| (10 + 2 Category) | (Graduate Category) | ||
| A | 60 | 5:6 | 5:3 |
| B | 50 | 5:5 | 5:2 |
| C | 35 | 5:3 | 4:3 |
| D | 45 | 6:5 | 4:2 |
| E | 41 | 4:3 | 3:2 |
Which state will have the highest number of female population (in the Graduate category), if the population of each state is 1 million?
Question 6
The given table gives the percentage distribution of population of five states A, B, C, D, E on the basis of Education and also on the basis of sex. Study the table and answer the questions that follow.
| State | Percentage of Educated Population | Proportion of Males and Females | |
|---|---|---|---|
| (10 + 2 Category) | (Graduate Category) | ||
| A | 60 | 5:6 | 5:3 |
| B | 50 | 5:5 | 5:2 |
| C | 35 | 5:3 | 4:3 |
| D | 45 | 6:5 | 4:2 |
| E | 41 | 4:3 | 3:2 |
Find out the total number of females in the Graduate category in State D (Total population is 2 million) and State E (Total population is 1 million).
Question 7
The following table presents the production of electronic items (TVs and LCDs) in a factory during the period from 2006 to 2010:
| Year | 2006 | 2007 | 2008 | 2009 | 2010 |
|---|---|---|---|---|---|
| TVs | 6000 | 9000 | 13000 | 11000 | 8000 |
| LCDs | 7000 | 9400 | 9000 | 10000 | 12000 |
What is the difference between averages of production of LCDs and TVs from 2006 to 2008?
Question 8
The following table presents the production of electronic items (TVs and LCDs) in a factory during the period from 2006 to 2010:
| Year | 2006 | 2007 | 2008 | 2009 | 2010 |
|---|---|---|---|---|---|
| TVs | 6000 | 9000 | 13000 | 11000 | 8000 |
| LCDs | 7000 | 9400 | 9000 | 10000 | 12000 |
What is the year in which production of TVs is half the production of LCDs in the year 2010?
Question 9
Study the following graph carefully and answer the question given below it :
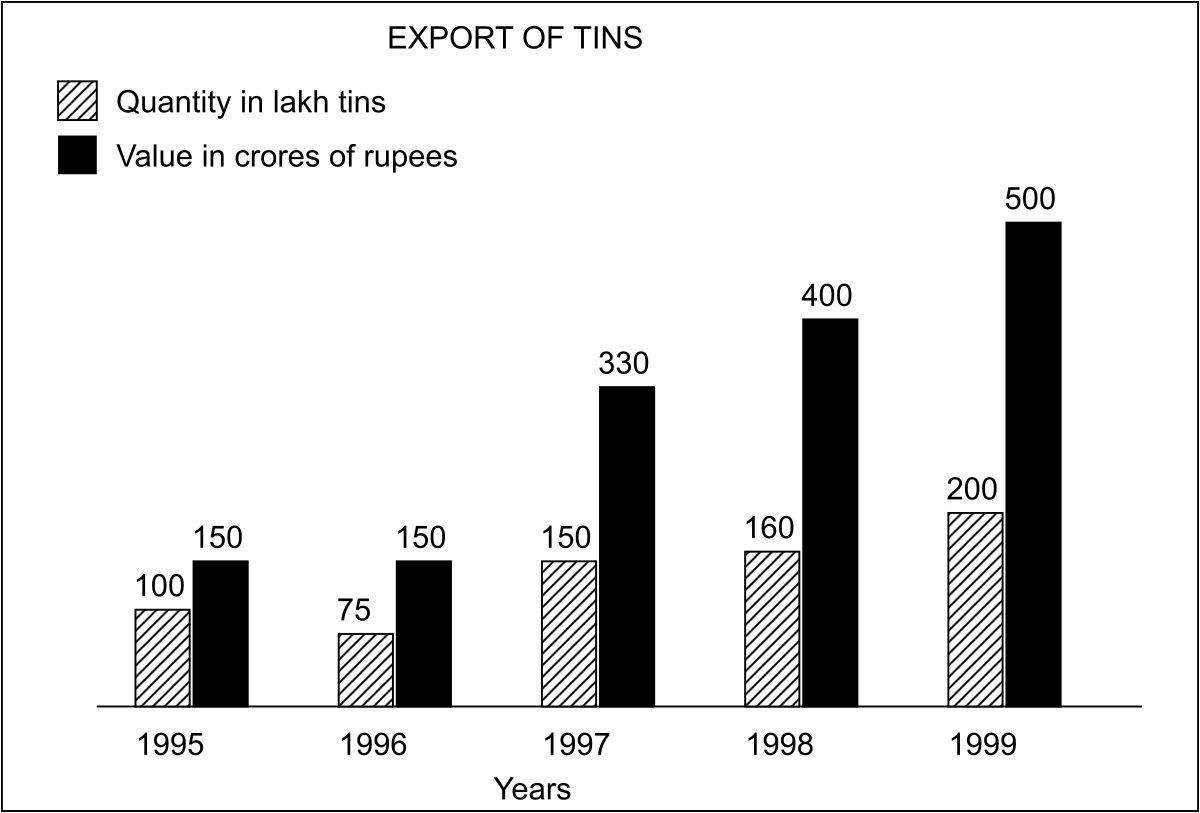
What was the approximate percentage increase in export value from 1995 to 1999 ?
Question 10
. The following pie chart indicates the expenditure of a country on various sports during a particular year. Study the pie chart and answer the question that follows.
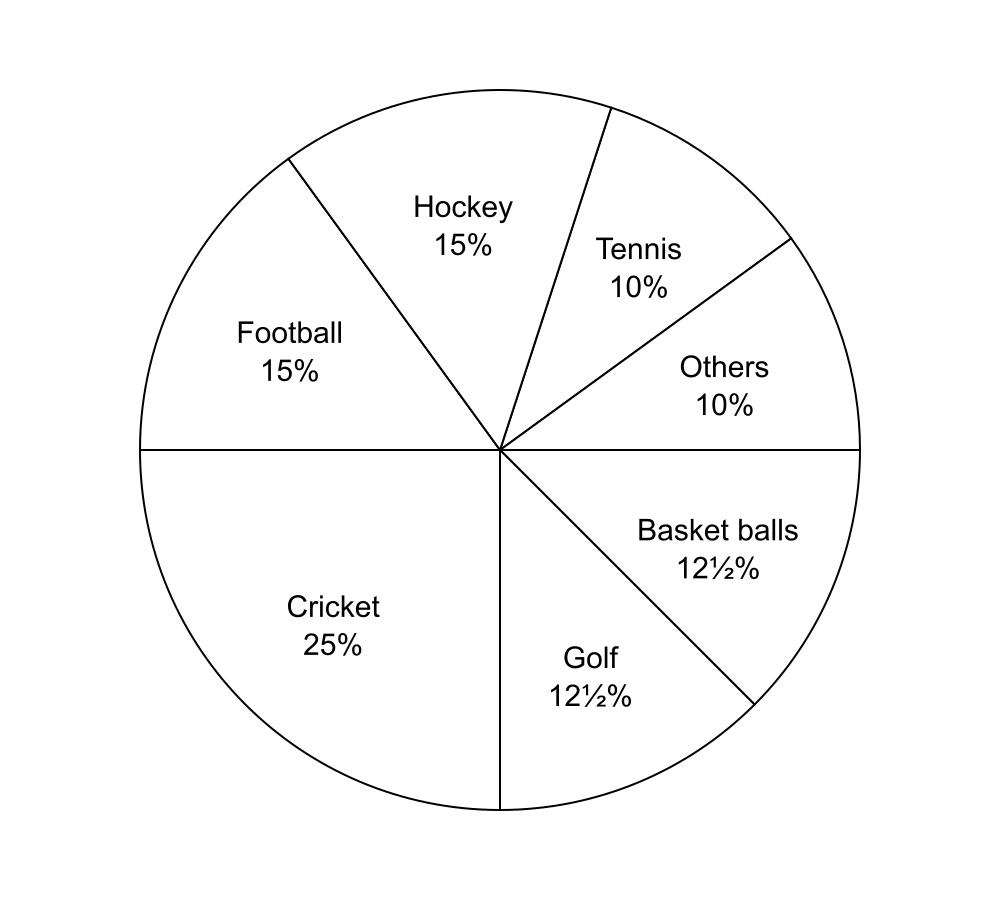
The ratio of the total expenditure on football to that of expenditure on hockey is :
Practise for these exams
-
UGC NET Paper I
-
CUSAT CAT LLM