
ColorLight : Dark Red 3 : 4 Blue 5 : 3 Green 1 : 3 Pink 1 : 7 Yellow 9 : 5 Orange 7 : 9 In a box, there are several balls. The pie-chart shows the percentage-wise distribution of 6 different colours…
Question and options
| Color | Light : Dark |
|---|---|
| Red | 3 : 4 |
| Blue | 5 : 3 |
| Green | 1 : 3 |
| Pink | 1 : 7 |
| Yellow | 9 : 5 |
| Orange | 7 : 9 |
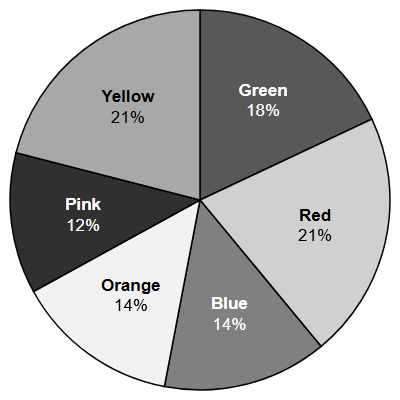
In a box, there are several balls. The pie-chart shows the percentage-wise distribution of 6 different colours of balls; and total number of balls = 1000. Also, the ratio of the light and dark shades of the six colours of balls is given.
What is the ratio of dark pink balls to the dark green balls?
- 6:9
- 7:8
- 7:9
- 6:8
Answer and explanation
Correct answer: C - 7:9
Pink = 120, dark pink = 7/8 x 120 = 105; green = 180, dark green = 3/4 x 180 = 135. 105:135 = 7:9.
Practice for these exams
-
JIPMAT
Related question papers
Related exam syllabi
More solved explanations in Data interpretation
- Study the given table and answer the question that follows: Total Number of Faculties in Different Departments of an Institute and Percentage of Females and males.…
- YearSteel production 2017 238 2018 267 2019 301 2020 346 2021 382 2022 393 2023 438 2024 471 How many years have shown production of steel higher than the average…
- Study the given bar graph carefully and answer the question that follows : 501001502002503003500No. of TVs (in thousand)Production of TVs by 5 companies in…
- Direction : The following pie chart shows the annual agricultural yield of a certain place. Study the above chart and answer the question given below : The…
- Directions: Study the bar diagram carefully and answer the question based on it. Birth Rate in Different Countries0510152025303540455055Birth rates per…