
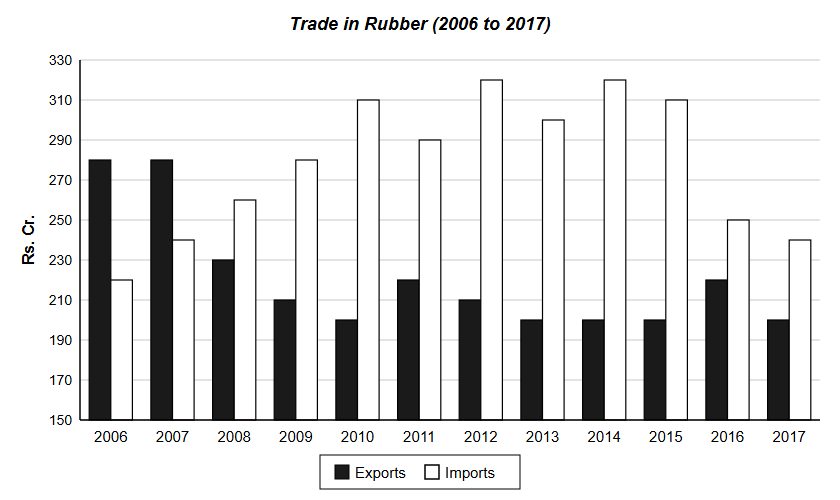
Analyze the given data for exports and imports of rubber in Rs. crores from 2006 to 2017 and answer the question based on the analysis. Average annual exports for the given period 2006-2017 was…
Question and options
Analyze the given data for exports and imports of rubber in Rs. crores from 2006 to 2017 and answer the question based on the analysis.
Average annual exports for the given period 2006-2017 was approximately
Average annual exports for the given period 2006-2017 was approximately
- Rs. 230 Cr
- Rs. 220 Cr
- Rs. 210 Cr
- Rs. 190 Cr
Answer and explanation
Correct answer: B - Rs. 220 Cr
Exports read from chart: 280,280,230,210,200,220,210,200,200,200,220,200; total 2650, average 220.8, about Rs 220 Cr.
Practice for these exams
-
IPMAT Indore
Related question papers
Related exam syllabi
More solved explanations in Data interpretation
- Five friends A, B, C, D, and E go on a trip together. Each of them likes at least one of the following three activities: Countryside Sightseeing, Shopping, and…
- Directions: The table gives the percentage of marks obtained by seven students in six different subjects in an examination. Study the table and answer the question…
- Directions: Study the following pie charts carefully and answer this question. It consists of data on admissions to graduate and postgraduate courses in different…
- A teacher has partial data of the student result: Sex Grade A Grade B Grade C Total Girls 40 Boys 5 Total 30 The other information available is: 1. Half the…
- In a company, 12.5% of the workers are Administrators, 37.5% are Engineers and 50% are Labours. If the total number of Engineers is 75, then the number of Labours is