
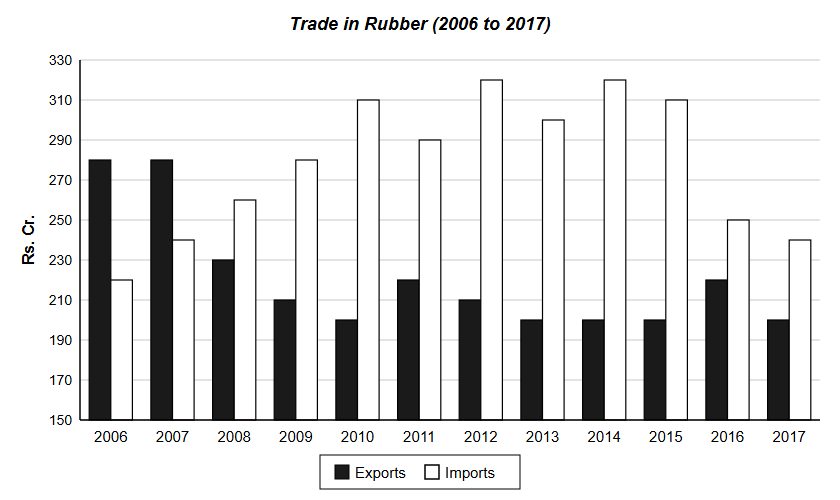
Analyze the given data for exports and imports of rubber in Rs. crores from 2006 to 2017 and answer the question based on the analysis. The percentage decline in exports during the period 2006-2011…
Question and options
Analyze the given data for exports and imports of rubber in Rs. crores from 2006 to 2017 and answer the question based on the analysis.
The percentage decline in exports during the period 2006-2011 is more than the percentage decline in exports during 2012-2017 by approximately
The percentage decline in exports during the period 2006-2011 is more than the percentage decline in exports during 2012-2017 by approximately
- 16.5
- 20.5
- 12.5
- 21.5
Answer and explanation
Correct answer: A - 16.5
Exports 2006->2011: 280->220, decline 21.43%. 2012->2017: 210->200, decline 4.76%. Difference about 16.7, closest 16.5.
Practice for these exams
-
IPMAT Indore
Related question papers
Related exam syllabi
More solved explanations in Data interpretation
- Directions: Study the graph to answer the question. Exports from Three Companies Over the Years (in ₹…
- Abhishek’s total income for 2019 was ₹56,000. He allocated this income as follows: food 23%, housing 15%, child’s education 12%, transport 10%, clothing 10%,…
- Answer the question given below by studying the following graph : (Number of students appeared and passed in the examination of various classes of a school in the…
- Degree wise Break-up of Expenditure of a Family in a Month: Total amount spent in a month = ₹45,800 What is the total amount spent by the family on Entertainment…
- Following pie-charts show distribution of sales of Hindi and English newspapers in five cities A, B, C, D and E : The ratio of average number of English newspapers…