
NCHM JEE Data interpretation Previous Year Questions
Try the preview and open any solution for a worked explanation.
NCHM JEE practice pack
The practice pack for NCHM JEE is coming soon to LawMint.
Question 1
Directions: Study the bar diagram carefully and answer the question based on it.
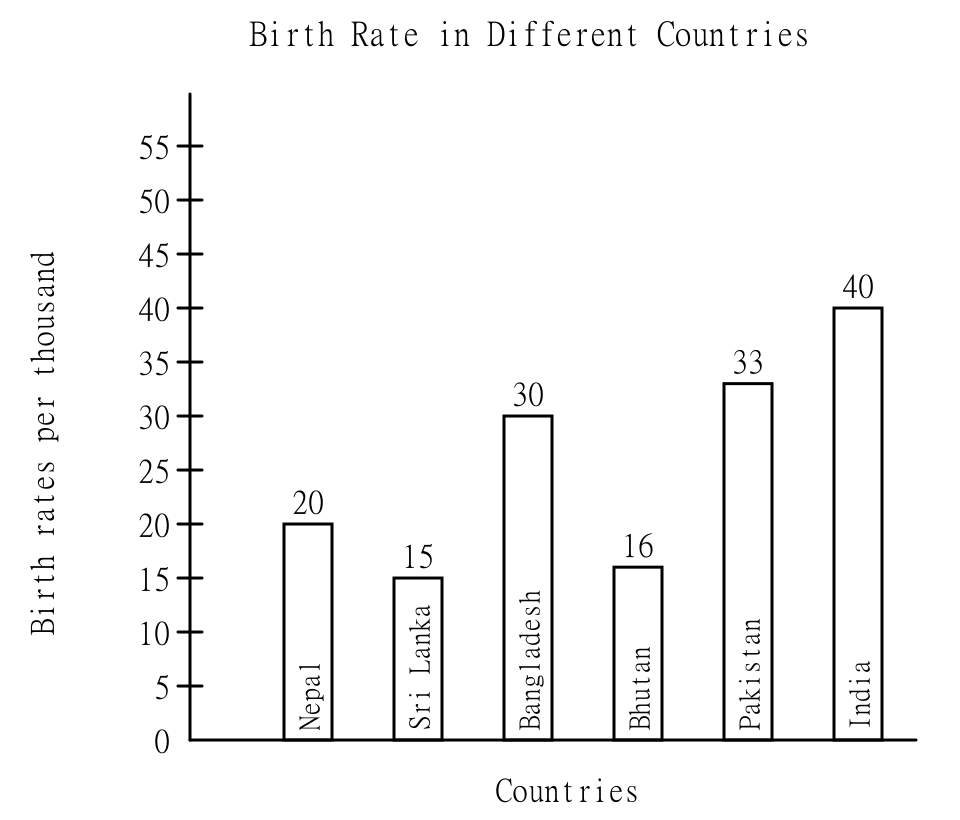
The birth rate of which country is 25% more than that of Bhutan?
Question 2
Directions: Study the bar diagram carefully and answer the question based on it.
The birth rate of Pakistan is what percent of birth rate of Nepal?
Question 3
Directions: Study the bar diagram carefully and answer the question based on it.
The birth rate of India is how many times the birth rate of Bhutan?
Question 4
Directions: Study the bar diagram carefully and answer the question based on it.
What is the ratio of birth rates of Pakistan to Sri Lanka?
Question 5
Directions: Study the bar diagram carefully and answer the question based on it.
By how much percent is the birth rate of Nepal less than the birth rates of Bangladesh?
Question 6
Study the given bar graph carefully and answer the question that follows :
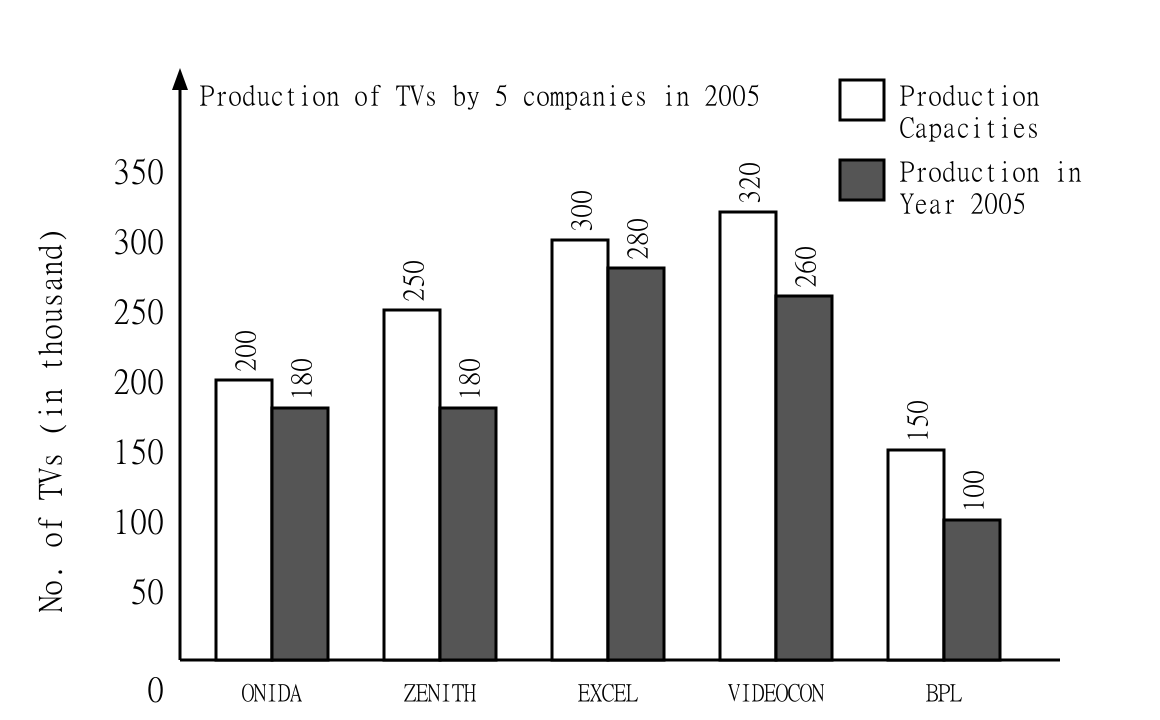
In year 2005, which company had the maximum percentage of unutilized capacity ?
Question 7
Study the given bar graph carefully and answer the question that follows :
In year 2005, which company had the minimum percentage of unutilized capacity ?
Question 8
Study the given bar graph carefully and answer the question that follows :
The TVs produced by ‘Excel’ form what percentage of the total production ?
Question 9
Directions: The table shows the number of new employees added to different categories of employees in a company and also the number of employees from these categories who left the company every year since the foundation of the company in 2012.
| Year | Managers | Technicians | Operators | Accountants | Peons | |||||
|---|---|---|---|---|---|---|---|---|---|---|
| New | Left | New | Left | New | Left | New | Left | New | Left | |
| 2012 | 760 | – | 1200 | – | 880 | – | 1160 | – | 820 | – |
| 2013 | 280 | 120 | 272 | 120 | 256 | 104 | 200 | 100 | 184 | 96 |
| 2014 | 179 | 92 | 240 | 128 | 240 | 120 | 224 | 104 | 152 | 88 |
| 2015 | 148 | 88 | 236 | 96 | 208 | 100 | 248 | 96 | 196 | 80 |
| 2016 | 160 | 72 | 256 | 100 | 192 | 112 | 272 | 88 | 224 | 120 |
| 2017 | 193 | 96 | 288 | 112 | 248 | 144 | 260 | 92 | 200 | 104 |
During the period between 2012 and 2017, the total number of Operators who left the company is what per cent of the total number of Operators who joined the company?
Question 10
Directions: The table shows the number of new employees added to different categories of employees in a company and also the number of employees from these categories who left the company every year since the foundation of the company in 2012.
| Year | Managers | Technicians | Operators | Accountants | Peons | |||||
|---|---|---|---|---|---|---|---|---|---|---|
| New | Left | New | Left | New | Left | New | Left | New | Left | |
| 2012 | 760 | – | 1200 | – | 880 | – | 1160 | – | 820 | – |
| 2013 | 280 | 120 | 272 | 120 | 256 | 104 | 200 | 100 | 184 | 96 |
| 2014 | 179 | 92 | 240 | 128 | 240 | 120 | 224 | 104 | 152 | 88 |
| 2015 | 148 | 88 | 236 | 96 | 208 | 100 | 248 | 96 | 196 | 80 |
| 2016 | 160 | 72 | 256 | 100 | 192 | 112 | 272 | 88 | 224 | 120 |
| 2017 | 193 | 96 | 288 | 112 | 248 | 144 | 260 | 92 | 200 | 104 |
For which of the following categories, the percentage increase in the number of employees working in the company from 2012 to 2017 was the maximum?
Previous papers with Data interpretation questions
NCHM JEE practice pack
The practice pack for NCHM JEE is coming soon to LawMint.