
Jammu & Kashmir Prosecuting Officer Quantitative Aptitude & Data Interpretation Previous Year Questions
Try the preview and open any solution for a worked explanation.
Jammu & Kashmir Prosecuting Officer practice pack
The practice pack for Jammu & Kashmir Prosecuting Officer is coming soon to LawMint.
Question 1
Directions: Study the bar graph given below and answer this question. It consists of data on the number of students who passed (in thousands) from two universities between the years 2003 and 2008.
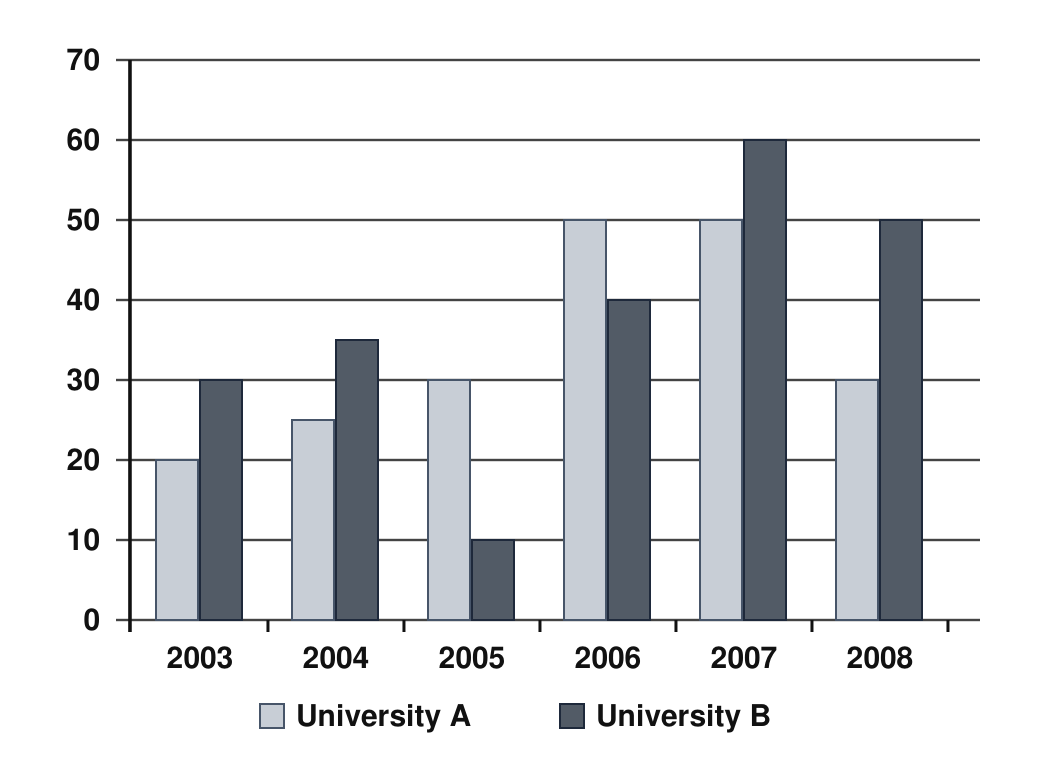
What is the sum of students passing from University B in 2003, 2005, and 2006 together?
Question 2
Directions: Study the bar graph given below and answer this question. It consists of data on the number of students who passed (in thousands) from two universities between the years 2003 and 2008.
What is the ratio of the number of students who passed University A in the year 2007 and the number of students who passed University B in the year 2004?
Question 3
Directions: Study the bar graph given below and answer this question. It consists of data on the number of students who passed (in thousands) from two universities between the years 2003 and 2008.
The number of students from University B in the year 2008 is approximately what percentage of the total number of students passed from University A over the years?
Question 4
Directions: Study the bar graph given below and answer this question. It consists of data on the number of students who passed (in thousands) from two universities between the years 2003 and 2008.
What is the ratio between the number of students passed in the years 2007, 2008, and 2005 from University A?
Question 5
Directions: Study the bar graph given below and answer this question. It consists of data on the number of students who passed (in thousands) from two universities between the years 2003 and 2008.
What is the difference between the total number of students who passed from University A and University B together in 2007 and the total number of students passed from University A and University B together in 2005?
Question 6
Directions: Study the bar graph given below and answer this question.
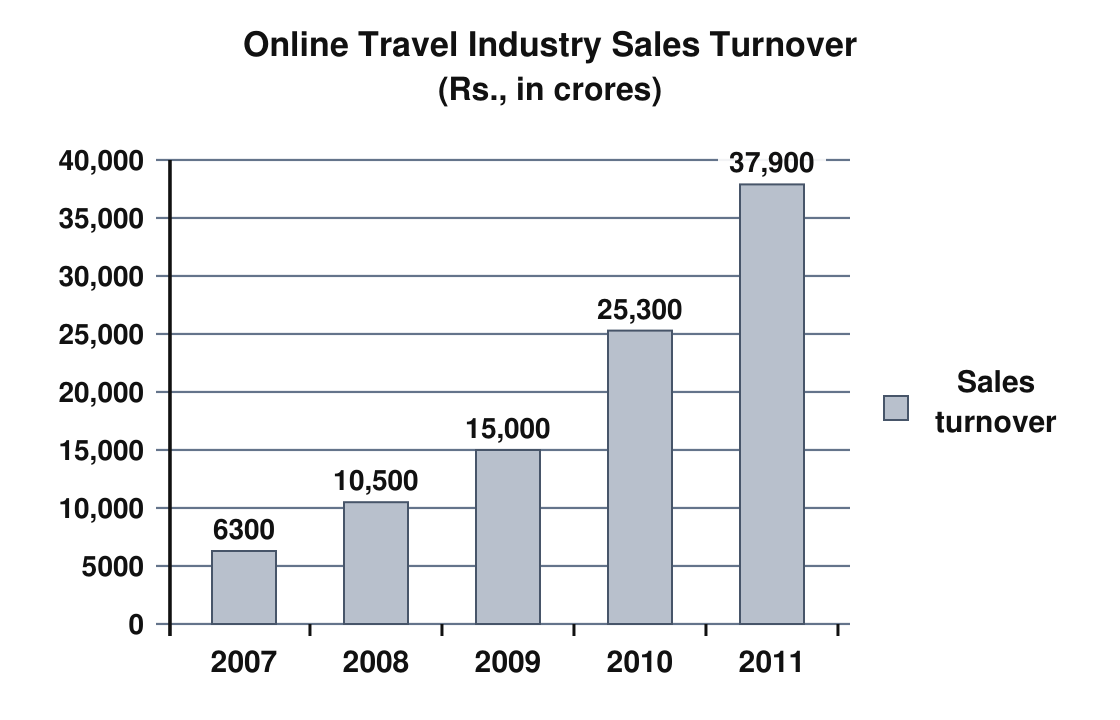
Which year witnessed the maximum growth in sales turnover in absolute terms?
Question 7
Directions: Study the bar graph given below and answer this question.
Which year witnessed the maximum growth in sales turnover in percentage terms?
Question 8
Directions: Study the bar graph given below and answer this question.
What is the average sales turnover during all the years (₹ in crores)?
Question 9
Directions: Study the bar graph given below and answer this question.
What is the approximate percentage growth between 2007 and 2011?
Question 10
Directions: Study the bar graph showing Online Travel Industry Sales Turnover in rupees crores for 2007 to 2011 and answer this question.
For each of the four consecutive year-to-year intervals 2007 to 2008, 2008 to 2009, 2009 to 2010 and 2010 to 2011, calculate the absolute increase in turnover by subtracting the earlier year's turnover from the later year's turnover. Take the arithmetic mean of these four absolute increases. How many of the four increases are strictly greater than that mean?
Quantitative Aptitude & Data Interpretation subtopics in Jammu & Kashmir Prosecuting Officer papers
Previous papers with Quantitative Aptitude & Data Interpretation questions
Jammu & Kashmir Prosecuting Officer practice pack
The practice pack for Jammu & Kashmir Prosecuting Officer is coming soon to LawMint.